1.1 Data
A statistical analysis starts with a set of data. We construct a set of data by first deciding what cases we want to study. For each case, we record information about characteristics that we call variables.
The following example illustrates the use of these terms in describing a set of data.
Example 1.1 Cryptocurrencies.
![]()
Cryptocurrencies are decentralized currencies that function without a central bank. The first cryptocurrency, Bitcoin, was created by a person or persons using the name Satoshi Nakamoto and was first released as open-source software in 2009. Since then, many cryptocurrencies have raised money through Initial Coin Offerings (ICOs).1 Figure 1.1 gives information for the nine ICOs that have raised more than $100 million; these are the cases.
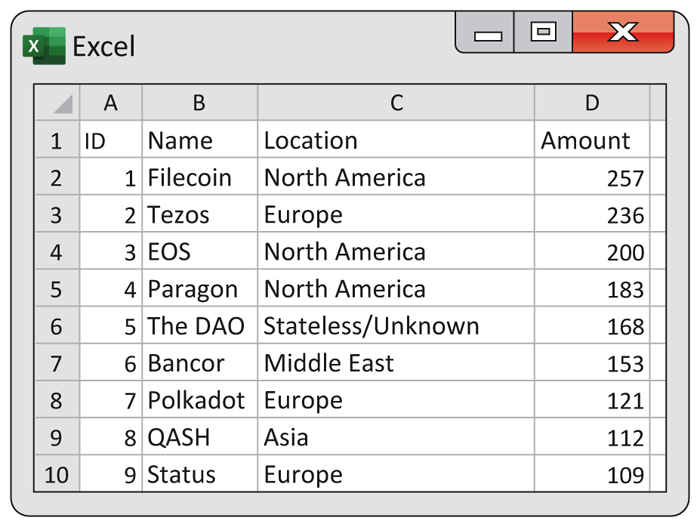
Figure 1.1 Cryptocurrency data, Example 1.1.
Data for each case are listed in a different row. The names of the variables (ID, Name, Location, and Amount) appear in the first row. Values of the variables are given as columns. Location gives the region of the world where the ICO originated. Note that the value North America is associated with three ICOs, while Asia is associated with only one. The variable Amount is the amount raised by the ICO, expressed in millions of U.S. dollars. The values range from $109M to $257M. ID, a label variable, has the ICOs numbered from 1 to 9. Name is the name of the ICO. Since the names are all different, this variable could also be used as a label variable.
Some variables, such as Location, simply place ICOs into categories. Other variables, like Amount, take on numerical values that we can use to do arithmetic. It makes sense to give an average of the ICO amounts, but it does not make sense to give an “average” location. These ideas lead us to distinguish between two types of variables.
Example 1.2 Categorical and quantitative variables for cryptocurrencies.
![]()
The ICO file has four variables: ID, Name, Location, and Amount. ID, Name, and Location are categorical variables. Amount is a quantitative variable. You should choose the label for your cases carefully. In our cryptocurrency example, Location would not be a good choice for a label because, for example, Filecoin, EOS, and Paragon are all located in North America. In contrast, the variable ID has different values, 1, 3, and 4, for these cases and is the label variable that we use for this data set. Although ID has values 1 to 9, it is not a quantitative variable; the average of these values is not a meaningful quantity.
We sometimes use the term observation to describe the data for a particular case. So, in our Cryptocurrency example, we have nine observations. Each observation consists of four pieces of data entered into a row of Figure 1.1.
In this and the following two chapters, we focus on relatively simple situations where the structure of the data is straightforward. In other situations, some judgment may be needed to define the characteristics of the data. For example, suppose we study the average daily temperatures in the counties of a particular state for a year. For one study, we could define the cases as the counties in the state and the daily average temperatures as individual variables. For a different study, we could use the combination of the county and the day as the case. The choice will often depend on the particular analysis being performed.
The display in Figure 1.1 is from an Excel spreadsheet. Spreadsheets are very useful for doing the kind of simple computations that you will do in Check-in question 1.2. You can type in a formula and have the same computation performed for each row.
Note that the names we have chosen for the variables in our spreadsheet
do not include spaces. Someone else might have chosen the name ICO
Proceeds for the amount of the ICO rather than Amount.
![]() In some statistical software packages, spaces are not allowed in
variable names.
If you are creating spreadsheets for eventual use with statistical
software that has this constraint, you need to avoid spaces in variable
names. Another convention is to use an underscore (_) where you would
normally use a space. For our data set, we could have used ICO_Proceeds
instead of Amount.
In some statistical software packages, spaces are not allowed in
variable names.
If you are creating spreadsheets for eventual use with statistical
software that has this constraint, you need to avoid spaces in variable
names. Another convention is to use an underscore (_) where you would
normally use a space. For our data set, we could have used ICO_Proceeds
instead of Amount.
Check-in
-
1.1 Read the spreadsheet. Refer to Figure 1.1. Give the Location and the Amount of the ICO named Polkadot.
-
1.2 Convert the dollars to euros. Refer to Example 1.1. Add another column to the ICO spreadsheet that gives the value of the ICO in millions of euros. Assume that 1 dollar equals 0.81 euro. Explain how you computed the entries in this column. Does the new column contain values for a categorical variable or for a quantitative variable? Explain your answer.

Another important part of the description of any quantitative variable is its unit of measurement. For Amount in Example 1.1, the unit of measurement is millions of dollars. In other settings, the unit of measurement may not be as obvious. For example, if we were measuring heights of children, we might choose to use either inches or centimeters. The units of measurement are an important part of the description of a quantitative variable.
Key characteristics of a data set
In practice, any set of data is accompanied by background information that helps us understand the data. When you plan a statistical study or explore data from someone else’s work, ask yourself the following questions:
- Who? What cases do the data describe? How many cases does the data set contain?
- What? How many variables do the data contain? What are the exact definitions of these variables? What are the units of measurement for each quantitative variable?
- Why? What purpose do the data have? Do we hope to answer some specific questions? Do we want to draw conclusions about cases other than the ones we actually have data for? Are the variables that are recorded suitable for the intended purpose?
Check-in
-
1.3 Who, what, and why questions for the cryptocurrency data. What cases do the data in Figure 1.1 describe? How many cases are there? How many variables are there? What are their definitions and units of measurement? What purpose do you think the data could have?
Example 1.3 Statistics class data: Key characteristics.

Suppose that you are a teaching assistant for a statistics class and one of your jobs is to keep track of the grades for students in two sections of the course. Who: The cases are the 37 students in the class. What: There are weekly homework assignments, two exams during the semester, and a final exam. Each of these components is given a numerical score, and the components are added to get a total score that can range from 0 to 1000. Cutoffs of 900, 800, 700, etc., are used to assign letter grades A, B, C, etc.
The spreadsheet for this course will have seven variables:
- An identifier for each student (ID).
- The number of points earned for homework.
- The number of points earned for the first exam.
- The number of points earned for the second exam.
- The number of points earned for the final exam.
- The total number of points earned.
- The letter grade earned.
The student identifier is a label, and the letter grade earned is a categorical variable. The units for all the other variables are points. Because we can do arithmetic with their values, these variables are quantitative variables. There are no units for the label and grade. Why: The data are used to compute the letter grades earned by the students in the course.
In our example of statistics class data, the possible values for the
grade variable are A, B, C, D, and F. When computing grade point
averages, many colleges and universities translate these letter grades
into numbers using
Sometimes, experts argue about numerical scales such as this. They ask
whether the difference between an A and a B should be considered the
same as the difference between a D and an F. Similarly, many
questionnaires ask people to respond on a 1 to 5 scale, with 1
representing strongly agree, 2 representing agree, etc. Again we could
ask whether the five possible values for this scale are equally spaced
in some sense. From a practical point of view, the averages that can
be computed when we convert categorical scales such as these to
numerical values frequently provide a very useful way to summarize
data.
![]() Nonetheless,
always be careful when converting categorical data to quantitative
data.
Nonetheless,
always be careful when converting categorical data to quantitative
data.
Example 1.4 Statistics class data for a different purpose.
Suppose that the data for the students in the introductory statistics class were also to be used to study relationships between student characteristics and success in the course. Here, we have decided to focus on the total points earned and the grade as the outcomes of interest. Other variables of interest would have been included—for example, gender, whether the student has taken a statistics course previously, and student classification as first, second, third, or fourth year. The label ID is a categorical variable, the total points earned is a quantitative variable, and the remaining variables are all categorical.
Check-in
-
1.4 Apartment rentals. A data set lists apartments available for students to rent. Information provided includes the monthly rent per person, whether cable is included free of charge, whether or not pets are allowed, the number of bedrooms, the number of bathrooms, and the distance to the campus. Describe the cases in the data set, give the number of variables, and specify whether each variable is categorical or quantitative.
Often, the variables in a statistical study are easy to understand: height in centimeters, study time in minutes, and so on. But each area of work also has its own special variables. A psychologist uses the Minnesota Multiphasic Personality Inventory (MMPI), and a physical fitness expert measures “VO2 max” (the volume of oxygen consumed per minute while exercising at maximum capacity). Each of these variables is measured with a special instrument. VO2 max is measured by exercising while breathing into a mouthpiece connected to an apparatus that measures oxygen consumed. Scores on the MMPI are based on the responses to a long questionnaire, which is also called an instrument.
Part of mastering your field of work is learning what variables are important and how they are best measured. Because details of particular measurements usually require knowledge of the particular field of study, we will say little about them.
![]() Be sure that each variable really does measure what you want it to.
A poor choice of variables can lead to misleading conclusions. Often, for example, the
rate
at which something occurs is a more meaningful measure than a simple
count of occurrences. Here is an example.
Be sure that each variable really does measure what you want it to.
A poor choice of variables can lead to misleading conclusions. Often, for example, the
rate
at which something occurs is a more meaningful measure than a simple
count of occurrences. Here is an example.
Example 1.5 Comparing colleges based on graduates.
Think about comparing colleges based on the numbers of graduates. This view tells you something about the relative sizes of different colleges. However, if you are interested in how well colleges succeed at graduating students whom they admit, it would be better to use a rate. For example, you can find data on the Internet on the six-year graduation rates of different colleges. These rates are computed by examining the progress of first-year students who enroll in a given year. Suppose that at College A there were 1000 first-year students in a particular year, and 800 graduated within six years. The graduation rate is
or 80%. College B has 2000 students who entered in the same year, and 1200 graduated within six years. The graduation rate is
or 60%. How do we compare these two colleges? College B has more graduates, but College A has a better graduation rate.
In Example 1.5, when we computed the graduation rate, we used the total number of students to adjust the number of graduates. We constructed a new variable by dividing the number of graduates by the total number of first-year students. Computing a rate is just one of several ways of adjusting one variable to create another. We often divide one variable by another to compute a more meaningful variable to study. Example 1.16 (page 18) is another type of adjustment.
Check-in
-
1.5 How should you express the change? Between the first exam and the second exam in your statistics course, you increased the amount of time that you spent working exercises. How would you express the effect of the increased time on your grade? Give reasons for your answer. (Answers and reasons will vary.)
-
1.6 Which variable would you choose? Refer to Example 1.5 on colleges and their graduates.
-
Give a setting in which you would prefer to evaluate the colleges based on the numbers of graduates. Give a reason for your choice.
-
Give a setting in which you would prefer to evaluate the colleges based on the graduation rates. Give a reason for your choice.
-
Check-in questions 1.5
and 1.6 illustrate an
important point about presenting the results of your statistical
calculations.
![]() Always consider how to best communicate your results to a general
audience.
For example, the numbers produced by your calculator or by statistical
software frequently contain more digits than are needed. Be sure that
you do not include extra information generated by software that will
distract from a clear explanation of what you have found.
Always consider how to best communicate your results to a general
audience.
For example, the numbers produced by your calculator or by statistical
software frequently contain more digits than are needed. Be sure that
you do not include extra information generated by software that will
distract from a clear explanation of what you have found.
Section 1.1 SUMMARY
-
A data set contains information on a number of cases. Cases may be customers, companies, subjects in a study, units in an experiment, or other objects.
-
For each case, the data give values for one or more variables. A variable describes some characteristic of a case, such as a person’s height, gender, or salary. Variables can have different values for different cases.
-
A label is a special variable used to identify cases in a data set.
-
Some variables are categorical, and others are quantitative. A categorical variable places each individual into a category, such as male or female. A quantitative variable has numerical values that measure some characteristic of each case, such as height in centimeters or annual salary in dollars.
-
The key characteristics of a data set answer the questions Who?, What?, and Why?
-
Converting a count to a rate is an example of adjusting one variable to create another.
Section 1.1 EXERCISES
-
1.1 Student organizations. A university website gives information about 30 student organizations. You have created a data set that summarizes this information. The variables in your data set are the name of the organization, whether the majority of the members are undergraduates or graduate students, the email address of the primary advisor, the day of the week when meetings are typically held, and the number of members in a recent year.
-
What are the cases?
-
Identify the variables and their possible values.
-
Classify each variable as categorical or quantitative.
-
Was a label used? Explain your answer.
-
Summarize the key characteristics of your data set.
-
-
1.2 Coffee ratings. A website ranks 50 different varieties of coffee. The data include the following variables: name of the coffee, price for a 12-ounce serving, overall rating (0 to 100), roast (light, medium, or dark), flavor, aroma, and body ratings (0 to 10).
-
What are the cases?
-
Identify the variables and their possible values.
-
Classify each variable as categorical or quantitative.
-
Was a label used? Explain your answer.
-
Summarize the key characteristics of your data set.
-
-
1.3 A survey of graduates. A college surveys its graduates who have earned a bachelor’s degree each year. For a recent year, the data include the responses of 1255 employed students who responded to the request for information about their job. The variables collected include an ID numbered 1 to 1255 that identified each respondent, the starting salary after graduation, the industry of employment (selected from a list of 20 possibilities), and the state of the employment if in the United States or the country of employment if not.
-
What are the cases?
-
Identify the variables and their possible values.
-
Classify each variable as categorical or quantitative.
-
Was a label used? Explain your answer.
-
Summarize the key characteristics of your data set.
-
-
1.4 An experiment on haptic feedback. A group of technology students is interested in whether haptic feedback (forces and vibrations applied through a joystick) is helpful in navigating a simulated game environment they created. To investigate this, they randomly assign 20 students to each of three joystick controller types and record the time it takes to complete a navigation mission. The joystick types are (1) a standard video game joystick, (2) a game joystick with force feedback, and (3) a game joystick with vibration feedback. The data collected included an ID variable that uniquely identifies each student, which of the three types of joystick was used, the time taken to complete the navigation mission, the age of the student, and the student’s satisfaction with the navigation, rated on a scale of 1 to 5 with 5 being the highest satisfaction.
-
What are the cases?
-
Identify the variables and their possible values.
-
Classify each variable as categorical or quantitative.
-
Was a label used? Explain your answer.
-
Summarize the key characteristics of your data set.
-
-
1.5 Employee application data. The human resources (HR) department keeps records on all employees in a company. Here is the information HR keeps in one of its data files: employee identification number, last name, first name, middle initial, department, number of years with the company, salary, education (coded as high school, some college, or college degree), and age.
-
What are the cases for this data set?
-
Do you think that the variable last name can be treated as a label? Explain your answer.
-
Describe each type of information as a label, a quantitative variable, or a categorical variable.
-
Set up a spreadsheet that could be used to record the data. Give appropriate column headings and five sample cases.
-
-
1.6 How would you rank cities? Various organizations rank cities and produce lists of the 10 or the 100 best cities, based on various measures. Create a list of criteria that you would use to rank cities. Include at least eight variables and give reasons for your choices. Say whether each variable is quantitative or categorical.
-
1.7 How would you rate colleges? Popular magazines rank colleges and universities on their “academic quality” in serving undergraduate students. Describe five variables that you would like to see measured for each college if you were choosing where to study. Give reasons for each of your choices.
-
1.8 Attending college in your state or in another state. The U.S. Census Bureau collects a large amount of information concerning higher education.2 For example, the bureau provides a table that includes the following variables: state, number of students from the state who attend college, and number of students who attend college in their home state.
-
What are the cases for this set of data?
-
Is there a label variable? If yes, what is it?
-
Identify each variable as categorical or quantitative.
-
Explain how you might use each of the quantitative variables to explain something about the states.
-
Consider a variable computed as the number of students in each state who attend college in the state divided by the total number of students from the state who attend college. Explain how you would use this variable to explain something about the states.
-
-
1.9 Alcohol-impaired driving fatalities. A report on drunk-driving fatalities in the United States gives the number of alcohol-impaired driving fatalities for each year from 1982 to 2017.3 Discuss at least three different ways that these numbers could be converted to rates. Give the advantages and disadvantages of each.