Chapter 1 EXERCISES
-
1.106 Sources of energy consumed. Energy consumed in the United States can be classified as coming from one of three sources: fossil fuels, nuclear and electric power, and renewable energy. In 2018, the energy from these three sources was 81.0, 8.4, and 11.5 quadrillion Btu, respectively. In 2008, the corresponding amounts were 83.0, 8.4, and 7.2.34 Write a description of the changes from 2008 to 2018 expressed in these data. Illustrate your summary with appropriate graphical summaries. Be sure to discuss both the amounts of energy from each source as well as the percents.
-
1.107 Sources of renewable energy consumed. Refer to the previous exercise. Renewable energy is classified into five sources. Here are the 2008 amd 2018 energy data for these sources:
Amount Source 2008 2018 Hydroelectric 2.511 2.688 Geothermal 0.192 0.218 Solar 0.074 0.951 Wind 0.546 2.533 Biomass 3.851 5.132 Write a description of the changes from 2008 to 2018 expressed in these data. Illustrate your summary with appropriate graphical summaries. Be sure to discuss both the amounts of energy from each source as well as the percents.
-
1.108

-
1.109 Highway fuel consumption. Refer to the previous exercise. Use graphical and numerical summaries to describe the distribution of highway fuel consumption for these vehicles. Be sure to justify your choice of summaries.
-
1.110 Flopping in the World Cup. Soccer players are often accused of spending an excessive amount of time dramatically falling to the ground followed by other activities, in attempts to show that a possible injury is very serious. It has been suggested that these tactics are often designed to influence the call of a referee or to take extra time off the clock. Recordings of the first 32 games of the 2014 World Cup were analyzed, and there were 302 times when the referee interrupted the match because of possible injuries. The number of injuries and the total time, in minutes, spent flopping for each of the 32 teams who participated in these matches was recorded.36 Here are the data:

Country Injuries Time Brazil 17 3.30 Chile 16 6.97 Honduras 15 7.67 Nigeria 15 6.42 Mexico 15 3.97 Costa Rica 13 3.80 USA 12 6.40 Ecuador 12 4.55 France 10 7.32 South Korea 10 4.52 Algeria 10 4.05 Iran 9 5.43 Russia 9 5.27 Ivory Coast 9 4.63 Croatia 9 4.32 Colombia 9 4.32 Uruguay 9 4.12 Greece 9 2.65 Cameroon 8 3.15 Germany 8 1.97 Spain 8 1.82 Belgium 7 3.38 Japan 7 2.08 Italy 7 1.60 Switzerland 7 1.35 England 7 3.13 Argentina 6 2.80 Ghana 6 1.85 Australia 6 1.83 Portugal 4 1.82 Netherlands 4 1.65 Bosnia and Herzegovina 2 0.40 Describe these data using the methods you learned in this chapter and write a short summary about flopping in the 2014 World Cup based on your analysis.
-
1.111 What graph would you use? What type of graph or graphs would you plan to make in a study of each of the following issues?
-
What makes of cars do students drive? How old are their cars?
-
How many hours per week do students study? How does the number of study hours change during a semester?
-
Which radio stations are most popular with students?
-
When many students measure the concentration of the same solution for a chemistry course laboratory assignment, do their measurements follow a Normal distribution?
-
-
1.112 Canadian international trade. The government organization Statistics Canada provides data on many topics related to Canada’s population, resources, economy, society, and culture. Go to the web page statcan.gc.ca/start-debut-eng.html. Under the “Subjects” tab, choose “International trade.” Pick some data from the resources listed and use the methods that you learned in this chapter to create graphical and numerical summaries. Write a report summarizing your findings that includes supporting evidence from your analyses.
-
1.113 Travel and tourism in Canada. Refer to the previous exercise. Under the “Subjects” tab, choose “Travel and tourism.” Pick some data from the resources listed and use the methods that you learned in this chapter to create graphical and numerical summaries. Write a report summarizing your findings that includes supporting evidence from your analyses.
-
 1.114 Leisure time for college students. You want
to measure the amount of “leisure time” that college students
enjoy. Write a brief discussion of two issues:
1.114 Leisure time for college students. You want
to measure the amount of “leisure time” that college students
enjoy. Write a brief discussion of two issues:
-
How will you define “leisure time”?
-
Once you have defined leisure time, how will you measure it?
-
-
1.115 How much vitamin C is needed?
The Food and Nutrition Board of the Institute of Medicine, working
in cooperation with scientists from Canada, have used scientific
data to answer this question for a variety of vitamins and
minerals.37
Their methodology assumes that needs, or requirements, follow a
distribution. They have produced guidelines called dietary
reference intakes for different gender-by-age combinations. For
vitamin C, there are three dietary reference intakes: the
estimated average requirement (EAR), which is the mean of the
requirement distribution; the recommended dietary allowance (RDA),
which is the intake that would be sufficient for 97% to 98% of the
population; and the tolerable upper level (UL), the intake that is
unlikely to pose health risks. For women aged 19 to 30 years, the
EAR is 60 milligrams per day (mg/d), the RDA is 75 mg/d, and the
UL is 2000 mg/d.38
-
The researchers assumed that the distribution of requirements for vitamin C is Normal. The EAR gives the mean. From the definition of the RDA, let’s assume that its value is the 97.72 percentile. Use this information to determine the standard deviation of the requirement distribution.
-
Sketch the distribution of vitamin C requirements for 19- to 30-year-old women. Mark the EAR, the RDA, and the UL on your plot.
-
-
1.116 How much vitamin C do men need? Refer to
the previous exercise. For men aged 19 to 30 years, the EAR is 75
milligrams per day (mg/d), the RDA is 90 mg/d, and the UL is 2000
mg/d. Answer the questions in the previous exercise for this
population.
-
1.117 How much vitamin C do women consume?
To evaluate whether or not the intake of a vitamin or mineral is
adequate, comparisons are made between the intake distribution and
the requirement distribution. Here is some information about the
distribution of vitamin C intake, in milligrams per day, for women
aged 19 to 30 years:39
Percentile (mg/d) Mean 1st 5th 19th 25th 50th 75th 90th 95th 99th 84.1 31 42 48 61 79 102 126 142 179 -
Use the 5th, the 50th, and the 95th percentiles of this distribution to estimate the mean and standard deviation of this distribution assuming that the distribution is Normal. Explain your method for doing this.
-
Sketch your Normal intake distribution on the same graph with a sketch of the requirement distribution that you produced in part (b) of Exercise 1.115.
-
Do you think that many women aged 19 to 30 years are getting the amount of vitamin C that they need? Explain your answer.
-
-
1.118 How much vitamin C do men consume? To
evaluate whether or not the intake of a vitamin or mineral is
adequate, comparisons are made between the intake distribution and
the requirement distribution. Here is some information about the
distribution of
vitamin C intake, in milligrams per day, for men aged 19 to 30
years:
Percentile (mg/d) Mean 1st 5th 19th 25th 50th 75th 90th 95th 99th 122.2 39 55 65 85 114 150 190 217 278 -
Use the 5th, the 50th, and the 95th percentiles of this distribution to estimate the mean and standard deviation of this distribution assuming that the distribution is Normal. Explain your method for doing this.
-
Sketch your Normal intake distribution on the same graph with a sketch of the requirement distribution that you produced in Exercise 1.116.
-
Do you think that many men aged 19 to 30 years in the United States are getting the amount of vitamin C that they need? Explain your answer.
-
-
1.119 Time spent studying. Do women study more than men? We asked the students in a large first-year college class how many minutes they studied on a typical weeknight. Here are the responses of random samples of 30 women and 30 men from the class:

Women Men 170 120 180 360 240 80 120 30 90 200 120 180 120 240 170 90 45 30 120 75 150 120 180 180 150 150 120 60 240 300 200 150 180 150 180 240 60 120 60 30 120 60 120 180 180 30 230 120 95 150 90 240 180 115 120 0 200 120 120 180 -
Examine the data. Why are you not surprised that most responses are multiples of 10 minutes? We eliminated one student who claimed to study 30,000 minutes per night. Are there any other responses that you consider suspicious?
-
Make a back-to-back stemplot of these data. Report the approximate midpoints of both groups. Does it appear that women study more than men (or at least claim that they do)?
-
Make side-by-side boxplots of these data. Compare the boxplots with the stemplot you made in part (b). Which to you prefer? Give reasons for your answer.
-
-
1.120 Spam filters. A university department installed a spam filter on its computer system. During a 21-day period, 6693 messages were tagged as spam. How much spam you get depends on what your online habits are. Here are the counts for some students and faculty in this department (with log-in IDs changed, of course):
ID Count ID Count ID Count ID Count AA 1818 BB 1358 CC 442 DD 416 EE 399 FF 389 GG 304 HH 251 II 251 JJ 178 KK 158 LL 103 All other department members received fewer than 100 spam messages. How many did the others receive in total? Make a graph and comment on what you learn from these data.

-
1.121 Phish.
One of the most favored songs of the band Phish is “Divided Sky.”
The band plays this song at many of their concerts. Frequently,
after the main theme, Trey, the guitarist, pauses before playing
the resolving note.40
The data file PHISH gives the date of each concert where “Divided
Sky” was played, the venue, and the length of the pause, in
minutes, for 366 concerts. Analyze the data and write a report
summarizing what you have found. Be sure to include graphical and
numerical summaries. Include the rationale for decisions that you
made in performing your analysis. For example, did you give any
consideration to the relatively large number of zeros?

PUTTING IT ALL TOGETHER
-
1.122 Blueberries and anthocyanins. Anthocyanins are compounds that have been associated with health benefits to the heart, bones, and brain. Blueberries are a good source of many different anthocyanins. Researchers at the Piedmont Research Station of North Carolina State University have assembled a database giving the concentrations of 18 different anthocyanins for 267 varieties of blueberries.41 Four of the anthocyanins measured are delphinidin-3-arabinoside, malvidin-3-arabinoside, cyanidin-3-galactoside, and delphinidin-3-glucoside, all measured in units of mg/100g of berries. In the data file, we have simplified the names of these anthocyanins to Antho1, Antho2, Antho3, and Antho4. Figure 1.35 gives graphical and numeric summaries from JMP for Antho1. Use this output to write a summary of the distribution of Antho1 using the methods and ideas that you learned in this chapter.

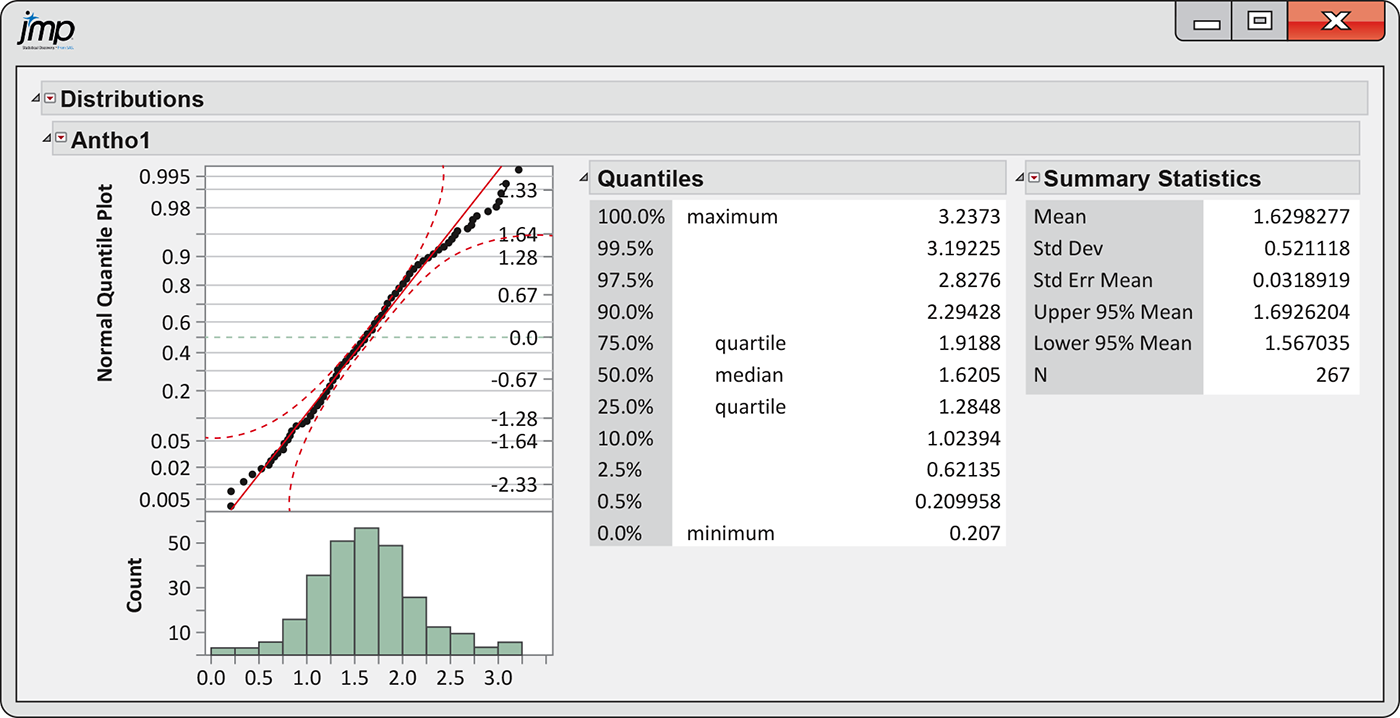
Figure 1.35 JMP descriptive statistics for Antho1, Exercise 1.122.
-
1.123 Blueberries and anthocyanins, Antho2. Refer to the previous exercise. Generate your own output for the analysis of Antho2 and use your output to write a summary of the distribution of Antho2 using the methods and ideas that you learned in this chapter.
-
1.124 Blueberries and anthocyanins, Antho3. Refer to Exercise 1.122. Figure 1.36 gives the JMP output for Antho3. Use this output to write a summary of the distribution of Antho3 using the methods and ideas that you learned in this chapter.
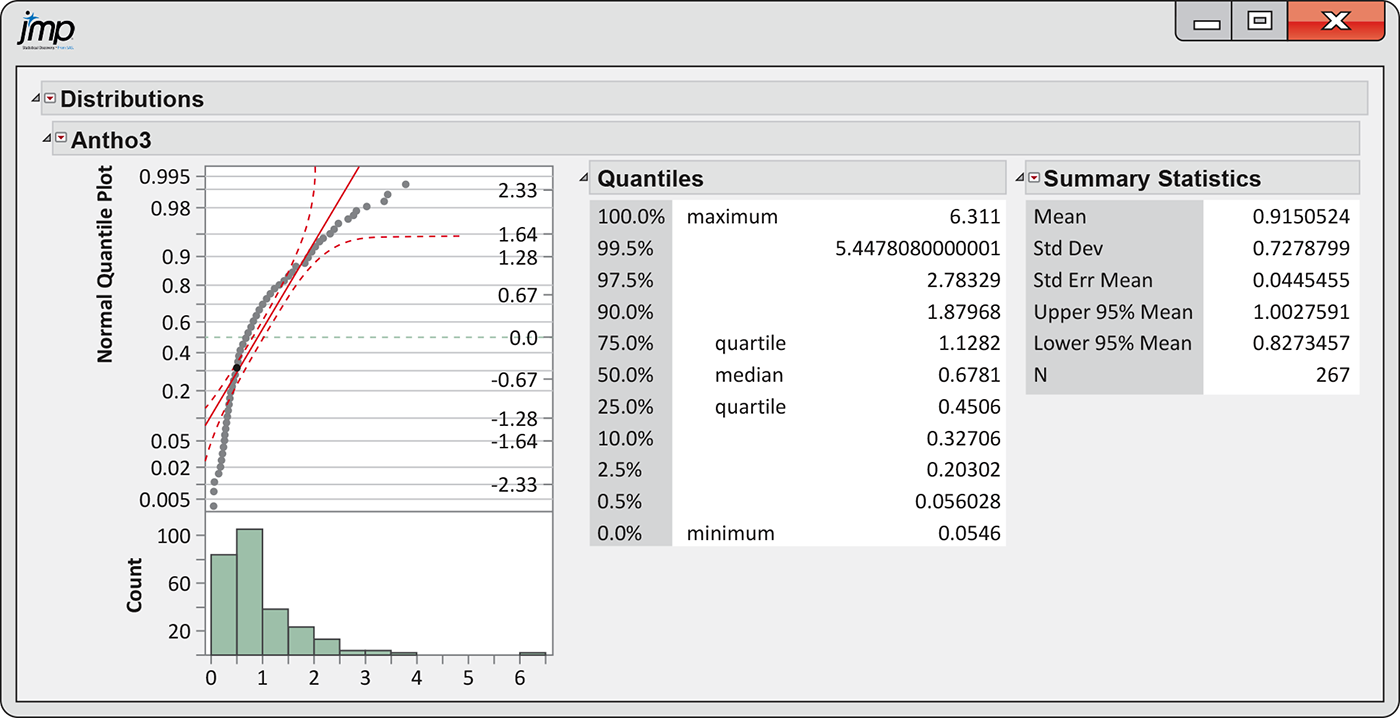
Figure 1.36 JMP descriptive statistics for Antho3, Exercise 1.124.
-
1.125 Blueberries and anthocyanins, Antho4. Refer to Exercise 1.122. Generate your own output for the analysis of Antho4 and use your output to write a summary of the distribution of Antho4 using the methods and ideas that you learned in this chapter.