3.1 Sources of Data
There are many sources of data. Some data are very easy to collect, but they may not be very useful. Other data require careful planning and need to be gathered only by professional staff. These data can be much more useful. A good statistical analysis starts with a careful study of the source of the data. Here is one type of source.
Anecdotal data
It is tempting to simply draw conclusions from our own experience, making no use of more broadly representative data. Stories or reports based on the ideas and opinions of individuals or groups do not provide the kind of data that can be used in a statistical analysis to draw conclusions.
Example 3.1 Pilates.
A magazine article about Pilates says that men need this form of exercise even more than women do. The article describes the benefits that two men received from taking Pilates classes. Although the article may accurately describe the experience of the two men, these data do not provide the kind of information that would be needed to draw a general conclusion that men need this form of exercise.
Example 3.2 What drugs are effective against COVID-19?
Near the beginning of the COVID-19 pandemic, numerous drugs were thought to be helpful in the treatment. Much of this thinking was based on anecdotal evidence.
These types of stories, or anecdotes, sometimes provide data. However, a common characteristic is that this type of data does not give us a sound basis for drawing conclusions.
Check-in
-
3.1 Hot dogs. A friend tells you that hot dogs taste better with mustard than with ketchup. Can you conclude that most people prefer mustard to ketchup on their hot dogs? Explain your answer.
-
3.2 Describe an anecdote. Find an example from some recent experience where anecdotal evidence was used to draw a conclusion that is not justified. Describe the example and explain why the anecdote should not be used in this way.
-
3.3 Studying for a statistics exam. You will have your first exam in a statistics course next week. A friend explains that he took the course last year and did very well on the exams without studying. Will you study for the exam? Explain how the data from your friend influenced your decision.
-
3.4 Are all vehicles this good? A friend has driven a Toyota Camry for more than 200,000 miles and with only the usual service maintenance expenses. Explain why not all Camry owners can expect this kind of performance.
Not all anecdotal data are bad. The experiences of an individual or a small group of individuals might suggest an interesting study that could be performed using more carefully collected data. The anecdotal data mentioned in Example 3.2 could lead to a carefully designed study to evaluate potential treatments.
Available data
Occasionally, data are collected for a particular purpose but can also serve as the basis for drawing sound conclusions about other research questions. We use the term available data for this type of data.
The library and the Internet can be good sources of available data. Because producing new data is expensive, we all use available data whenever possible. Here are two examples.
Example 3.3 Unemployment rates.
If you visit the U.S. Bureau of Labor Statistics website, bls.gov, you will find many interesting sets of data and statistical summaries (Figure 3.1). A recent posting in the Student Resources gave a graphic of employment data by state.1
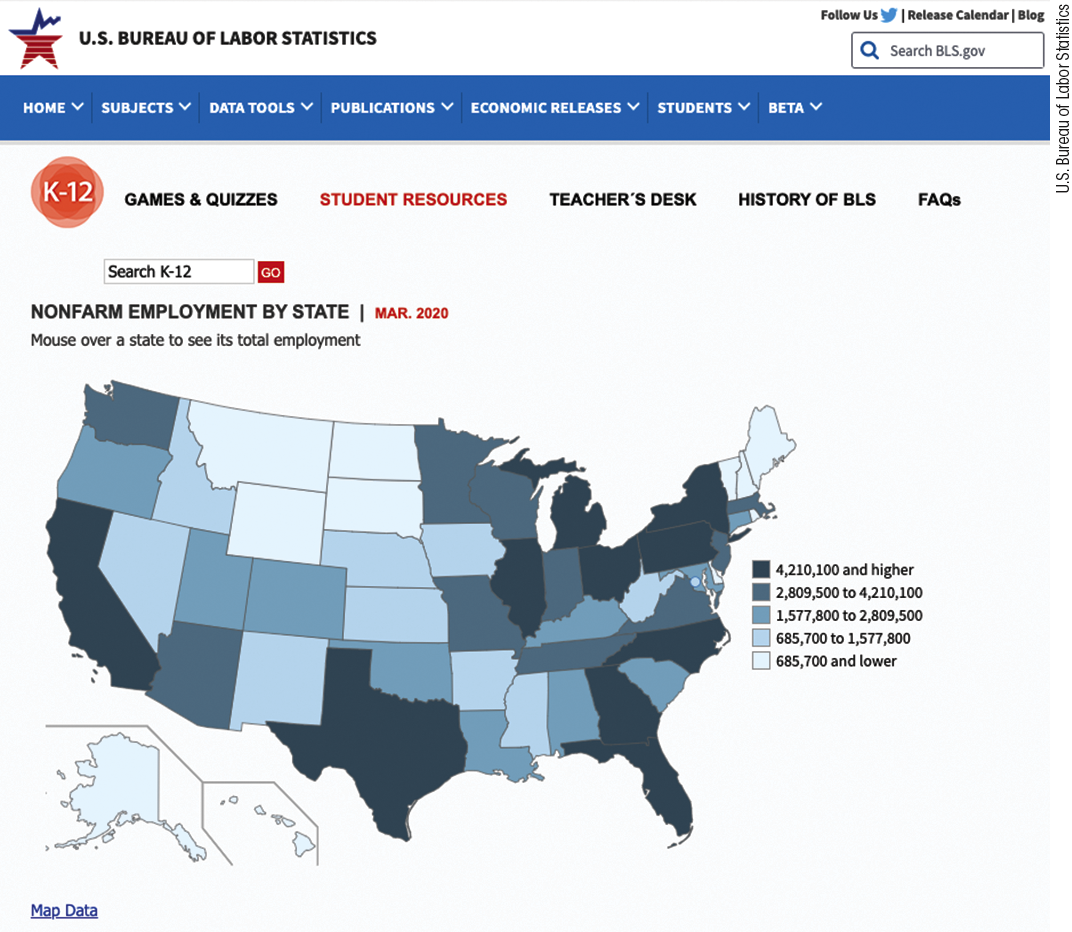
Figure 3.1 Websites of government statistical offices are prime sources of data. Here is a page from the U.S. Bureau of Labor Statistics website, Example 3.3.
Example 3.4 Start time for schools.
A publication from the National Center for Education Statistics2 reported that the average start time for U.S. public high schools was 8:00 a.m. The publication also noted that the American Academy of Pediatrics recommends that high schools start at 8:30 a.m. or later to give students the opportunity to get a sufficient amount of sleep.
Many nations have a single national statistical office, such as Statistics Canada (statcan.gc.ca) and Mexico’s INEGI (inegi.org.mx). More than 70 different U.S. agencies collect data. You can reach most of them through the U.S. government’s data site (usa.gov/statistics).
Check-in
-
3.5 How would you use the available data? Refer to Example 3.4. How could you use these data? Give two examples.
The validity of our conclusions from the analysis of data rests on a foundation of carefully collected data. We could use a survey of college athletes to estimate the percent who gamble. An experiment could be used to determine if restaurant patrons give higher tips when their server repeats their order carefully.
In this chapter, we will develop the skills needed to produce trustworthy data and to judge the quality of data produced by others. The techniques for producing data that we will study require no formulas, but they are among the most important ideas in statistics. Statistical designs for producing data rely on either sampling or experiments.
Sample surveys and experiments
How have the attitudes of Americans, on issues ranging from abortion to work, changed over time? Sample surveys are the usual tool for answering questions like these.
Example 3.5 The General Social Survey.
One of the most important sample surveys is the General Social Survey (GSS), conducted by the National Opinion Research Center (NORC), an organization affiliated with the University of Chicago.3 The GSS interviews about 3000 adult residents of the United States every other year.
The GSS selects a sample of adults to represent the larger population of all English-speaking and Spanish-speaking adults living in the United States. The idea of sampling is to study a part in order to gain information about the whole. Data are often produced by sampling a population of people or things. Opinion polls, for example, may report the views of the entire country based on interviews with a sample of about 1000 people. Government reports on employment and unemployment are produced from a monthly sample of about 60,000 households. The quality of manufactured items is monitored by inspecting small samples each hour or each shift.
Check-in
-
3.6 Check out the General Social Survey. Visit the General Social Survey website at gss.norc.org and go to the media room. Write a short summary of one of the reports you find at the site, paying particular attention to the methods used to collect the data.
In all our examples, the expense of examining every item in the population makes sampling a practical necessity. Timeliness is another reason for preferring a sample to a census, which is an attempt to contact every individual in the population. We want information on current unemployment and public opinion next week, not next year. Moreover, a carefully conducted sample is often more accurate than a census. Accountants, for example, sample a firm’s inventory to verify the accuracy of the records. Attempting to count every last item in the warehouse would be not only expensive but inaccurate. Bored people do not count carefully.
A sample survey collects information about a population by selecting and measuring a sample from the population. The goal is to get a picture of the population, disturbed as little as possible by the act of gathering information. Sample surveys are one kind of observational study.
Example 3.6 An important observational study.
The General Social Survey of Example 3.5 is an example of an observational study that is a sample survey.
Example 3.7 Baseball players have strong bones in their throwing arms.
A study of young baseball players measured the strength of the bones in their throwing arms. Subjects in a control group who were matched with the baseball players based on age were also measured. This is an example of an observational study that is not a sample survey. The study reported that bone strength was 30% higher in the baseball players.4
What can we conclude from this study? If you start to play baseball, will you have stronger bones in your throwing arm?
Example 3.8 Is there a cause-and-effect relationship?
Example 3.7 describes an observational study. People choose to participate in baseball or not. Is it possible that those who choose to play baseball have stronger arms than those who do not? The study does not address this question.
We can imagine an experiment that would remove these difficulties. From a large group of subjects, require some to play baseball and forbid the rest from playing. This is an experiment because the condition (playing baseball or not) is imposed on the subjects. Of course, this particular experiment is neither practical nor ethical.
Example 3.9 Baseball and bones.
Example 3.7 compared the arm bone strengths of baseball players with those of age-matched controls. Although the study tells us something about baseball players, the results are particularly interesting because they suggest that certain kinds of exercise can help us to build strong bones.
Check-in
-
3.7 Available data. Can available data be from an observational study? Can available data be from an experiment? Explain your answers.
-
3.8 Service dogs. A study measured the health-related quality of life (HRQOL) of 126 persons with a disability or illness. The researchers compared the HRQOL of 50 persons who currently lived with a service dog with 76 persons who were on a waiting list to receive one. The researchers concluded that those who lived with a service dog had better emotional HRQOL than those who did not.5 Is this an observational study or an experiment? Is it a sample survey? If it is an experiment, what is the intervention? Explain your answers.
-
3.9 Quality protein maize. Quality protein maize (QPM) is a variety of maize (corn) that has been bred to contain increased amounts of key proteins. A study randomized 211 children aged 7 to 56 months to receive either QPM or an improved conventional maize. Children who consumed the conventional maize grew (in height) at a slower rate than those who consumed the QPM.6 Is this an observational study or an experiment? Is it a sample survey? If it is an experiment, what is the treatment? Explain your answers.
An observational study, even one based on a carefully chosen sample, is a poor way to determine what will happen if we change something. The best way to see the effects of a change is to do an intervention—where we actually impose the change. When our goal is to understand cause and effect, experiments are the only source of fully convincing data.
Confounding occurs when an explanatory variable is related to one or more other variables that have an influence on the response variable. When this happens, we sometimes attribute a relationship to an explanatory variable when the effect is fully or partly due to the confounding variables.
In Example 3.7, the effect of baseball playing on arm bone strength is confounded with (mixed up with) other characteristics of the subjects in the study. Observational studies that examine the effect of a single variable on an outcome can be misleading when the effects of the explanatory variable are confounded with those of other variables.
Because experiments allow us to isolate the effects of specific variables, we generally prefer them. Here is an example.
Example 3.10 Red Light Purple Light.
Red Light Purple Light (RLPL) is a collection of activities designed to improve self-regulation, the ability to control one’s behavior. The effect of adding an RLPL intervention to a Bridge to Kindergarten (B2K) was examined in a study of 120 children with no prior preschool experience. The school readiness of the B2K children who received the RLPL intervention was compared with the school readiness of those who did not.7 This study is an experiment. The treatment is the inclusion of the RLPL activities.
Experiments usually require some sort of randomization. We begin the discussion of statistical designs for data collection in Section 3.2 with the principles underlying the design of experiments.
Check-in
-
3.10 Software for teaching creative writing. An educational software company wants to compare the effectiveness of its computer animation for teaching creative writing with that of a textbook presentation. The company tests the creative-writing skills of a number of second-year college students and then randomly divides them into two groups. One group uses the animation, and the other studies the text. The company retests all the students and compares the increase in creative-writing skills in the two groups. Is this an experiment? Why or why not? What are the explanatory and response variables?
-
3.11 Apples or apple juice? Food rheologists study different forms of foods and how the form of a food affects how full we feel when we eat it. One study prepared samples of apple juice and samples of apples with the same number of calories. Half of the subjects were fed apples on one day followed by apple juice on a later day; the other half received the apple juice followed by the apples. After eating, the subjects were asked about how full they felt. Is this an experiment? Why or why not? What are the explanatory and response variables?
Section 3.1 SUMMARY
-
Anecdotal data come from stories or reports about cases that do not necessarily represent a larger group of cases.
-
Available data are data that were produced for some other purpose but that may help answer a question of interest.
-
A sample survey collects data from a sample of cases that represent some larger population of cases.
-
A census collects data from all cases in the population of interest.
-
In an observational study, we observe individuals but we do not attempt to influence their responses.
-
In an experiment, a treatment or an intervention is imposed, and the responses are recorded.
Section 3.1 EXERCISES
In several of the following exercises, you are asked to identify the type of data described. Possible answers include anecdotal data, available data, observational data that are from sample surveys, observational data that are not from sample surveys, and experimental data. It is possible for some data to be classified in more than one category.
-
3.1 Not enough tuna. You like to eat tuna sandwiches. Recently you have noticed that there does not seem to be as much tuna as you expect when you open the can. Identify the type of data that this represents and describe how it can or cannot be used to reach a conclusion about the amount of tuna in cans of tuna. Is this anecdotal data, available data, an observational study, or an experiment? Explain your answer.
-
3.2 More about tuna. According to a story in Consumer Reports, three major producers of canned tuna agreed to pay $3,300,000 to settle claims in California that the amount of tuna in their cans was less than the amount printed on the label of the cans.8 What kind of data do you think was used in this situation to convince the producers to pay this amount of money to settle the claims? Explain your answer.
-
3.3 Satisfaction with allocation of concert tickets. Your college sponsored a concert that sold out.
-
After the concert, an article in the student newspaper reported interviews with three students who were unable to get tickets and were very upset. What kind of data does this represent? What kinds of conclusions can you draw from these data? Explain your answers.
-
A week later the student organization that sponsored the concert set up a website where students could rank their satisfaction with the way that the tickets were allocated using a 5-point scale with values “very satisfied,” “satisfied,” “neither satisfied nor dissatisfied,” “dissatisfied,” and “very dissatisfied.” The website was open to any students who chose to provide their opinion. How would you classify these data? Give reasons for your answer.
-
Suppose that the website in part (b) were changed so that only a sample of students from the college were invited by a text message to respond, and those who did not respond within three days were sent an additional text message reminding them to respond. How would your answer to part (b) change, if at all?
-
Is the description in part (c) an experiment? If yes, what is the treatment?
-
Write a short summary contrasting different types of data using your answers to parts (a), (b), (c), and (d) of this exercise.
-
-
3.4 What’s wrong? Explain what is wrong in each of the following statements.
Anecdotal data always come from an experiment.
-
A sample survey collects information on all subjects in the population of interest.
A treatment is imposed in a sample survey.
-
3.5 Does echinacea reduce the severity of the common cold? In a study designed to evaluate the benefits of taking echinacea when you have a cold, 719 patients were randomly divided into four groups. The groups were (1) no pills, (2) pills that had no echinacea, (3) pills that had echinacea but the subjects did not know whether or not the pills contained echinacea, and (4) pills that had echinacea and the bottle containing the pills stated that the contents included echinacea. The outcome was a measure of the severity of the cold.9
-
Identify the type of data collected in this study. Give reasons for your answer.
-
Is this an experiment? If yes, what is the treatment?
-