3.3 Sampling Design
A political scientist wants to know what percent of college-age adults consider themselves conservative. An automaker hires a market research firm to learn what percent of adults aged 18 to 35 recall seeing television advertisements for a new sport utility vehicle. Government economists inquire about average household income.
In all these cases, we want to gather information about a large group of individuals. We will not, as in an experiment, impose a treatment in order to observe the response. Also, time, cost, and inconvenience prohibit contacting every individual. In such cases, we gather information about only part of the group—a sample—in order to draw conclusions about the whole. Sample surveys are an important kind of observational study.
Notice that population is defined in terms of our desire for knowledge. If we wish to draw conclusions about all U.S. college students, that group is our population, even if only local students are available for questioning. The sample is the part from which we draw conclusions about the whole. The sample design refers to the method used to choose the sample from the population.
Example 3.29 The Reading Recovery program.

The Reading Recovery (RR) program has specially trained teachers who work one-on-one with at-risk first-grade students to help them learn to read. A study was designed to examine the relationship between the RR teachers’ beliefs about their ability to motivate students and the progress of the students they teach.16 The Reading Recovery International Data Evaluation Center website (www.idecweb.us) says that there are 13,823 RR teachers. The researchers send a questionnaire to a random sample of 200 of them. The population consists of all 13,823 RR teachers, and the sample is the 200 that were randomly selected.
Unfortunately, our idealized framework of population and sample does not exactly correspond to the situations that we face in many cases. In Example 3.29, the list of teachers was prepared at a particular time in the past. It is very likely that some of the teachers on the list are no longer working as RR teachers today. New teachers have been trained in RR methods and are not on the list. Despite these difficulties, we still view the list as the population. Also, we may have out-of-date addresses for some who are still working as RR teachers, and some teachers may choose not to respond to the survey questions.
In reporting the results of a sample survey, it is important to include all details regarding the procedures used. Follow-up mailings or phone calls to those who do not initially respond can help increase the response rate. The proportion of the original sample who actually provide usable data is called the response rate and should be reported for all surveys. If only 150 of the teachers who were sent questionnaires provided usable data, the response rate would be 150/200, or 75%.
Example 3.30 Response rate for the NATES survey.
The National Adult Training and Education (NATES) survey17
was designed to evaluate the feasibility of using a mailed survey as
an alternative to a telephone survey to collect education data from
U.S. adults. The survey was sent to 8405 adults, and 5480 responded.
The response rate was
Check-in
-
3.19 Are they satisfied? An educational research team wants to examine the relationship between faculty participation in decision making and job satisfaction in Mongolian public universities. They are planning to randomly select 300 faculty members from a list of 2500 faculty members in these universities. The Job Descriptive Index will be used to measure job satisfaction, and the Conway Adaptation of the Alutto-Belasco Decisional Participation Scale will be used to measure decision participation.
Describe the population for this study.
Describe the sample for this study.
-
How would you determine the response rate for this study? Can you calculate it from the information given? If your answer is yes, calculate it.
-
3.20 What is the impact of the taxes? A study was designed to assess the impact of taxes on forest land usage in part of the Upper Wabash River Watershed in Indiana.18 A survey was sent to 861 forest owners from this region, and 368 owners returned their surveys.
What is the sample for this study?
What is the population for this study?
-
How would you determine the response rate for this study? Can you calculate it from the information given? If your answer is Yes, calculate it.
Poor sample designs can produce misleading conclusions. Here is an example.
Example 3.31 Sampling pieces of steel.
A mill produces large coils of thin steel for use in manufacturing home appliances. The quality engineer wants to submit a sample of 5-centimeter squares to detailed laboratory examination. She asks a technician to cut a sample of 10 such squares. Wanting to provide “good” pieces of steel, the technician carefully avoids the visible defects in the coil material when cutting the sample. The laboratory results are wonderful, but the customers still complain about the material they are receiving.
In Example 3.31, the sample was selected in a manner that guaranteed that it would not be representative of the entire population. This sampling scheme displays bias, or systematic error, in favoring some parts of the population over others.
Example 3.32 Online polls.
Online polls use voluntary response samples, a particularly common form of biased sample. The sample who respond are not representative of the population at large. People who take the trouble to respond to an open invitation are not representative of the entire population.
The remedy for bias in choosing a sample is to allow chance to do the choosing so that there is neither favoritism by the sampler (Example 3.31) nor voluntary response (online opinion polls). Random selection of a sample eliminates bias by giving all individuals an equal chance to be chosen, just as randomization eliminates bias in assigning experimental units.
Simple random samples
The simplest sampling design amounts to placing names in a hat (the population) and drawing out a handful (the sample). This is simple random sampling.
Each treatment group in a completely randomized experimental design is an SRS drawn from the available experimental units. We select an SRS by labeling all the individuals in the population and using software or a table of random digits to select a sample of the desired size, just as in experimental randomization. Notice that an SRS not only gives every possible sample an equal chance to be chosen but also gives each individual an equal chance to be chosen. There are other random sampling designs that give each individual, but not each sample, an equal chance. One such design, systematic random sampling, is described in Exercise 3.40 (page 191).
How to select a simple random sample
![]()
The basic ideas needed to select a simple random sample are very similar to those that we discussed when we randomized subjects to treatments (Examples 3.20 and 3.21, pages 168 and 170). We first assign a label to each case in our population. Then we randomize using software or random digits from Table B.
Example 3.33 Brands.
![]()
A brand is a symbol or an image that is associated with a company. An effective brand identifies the company and its products. Using a variety of measures, dollar values for brands can be calculated. Let’s look at the top 100 brands.
Suppose that you want to write a research report on some of the characteristics of the companies in this elite group. You decide to look carefully at the websites of 10 companies from the list. One way to select the companies is to use a simple random sample.
Selection of a simple random sample using software
Most statistical software will select an SRS for you, eliminating the need for Table B. Excel and other software can do the job. There are four steps:
-
Create a data set with a label for each item in the population.
-
Generate a random number for each item of the population; add this variable to the data set.
Sort the data set by the random number column.
-
The simple random sample is obtained by taking elements in order from the sorted list until the desired sample size is reached.
Example 3.34 Select a random sample of brands using Excel.
![]()
Figure 3.7(a) gives the spreadsheet with the rank of the company and the company name in the first and second columns. Each of these variables can serve as a label. Only the first 12 of the 100 companies in the top 100 brands list are shown.
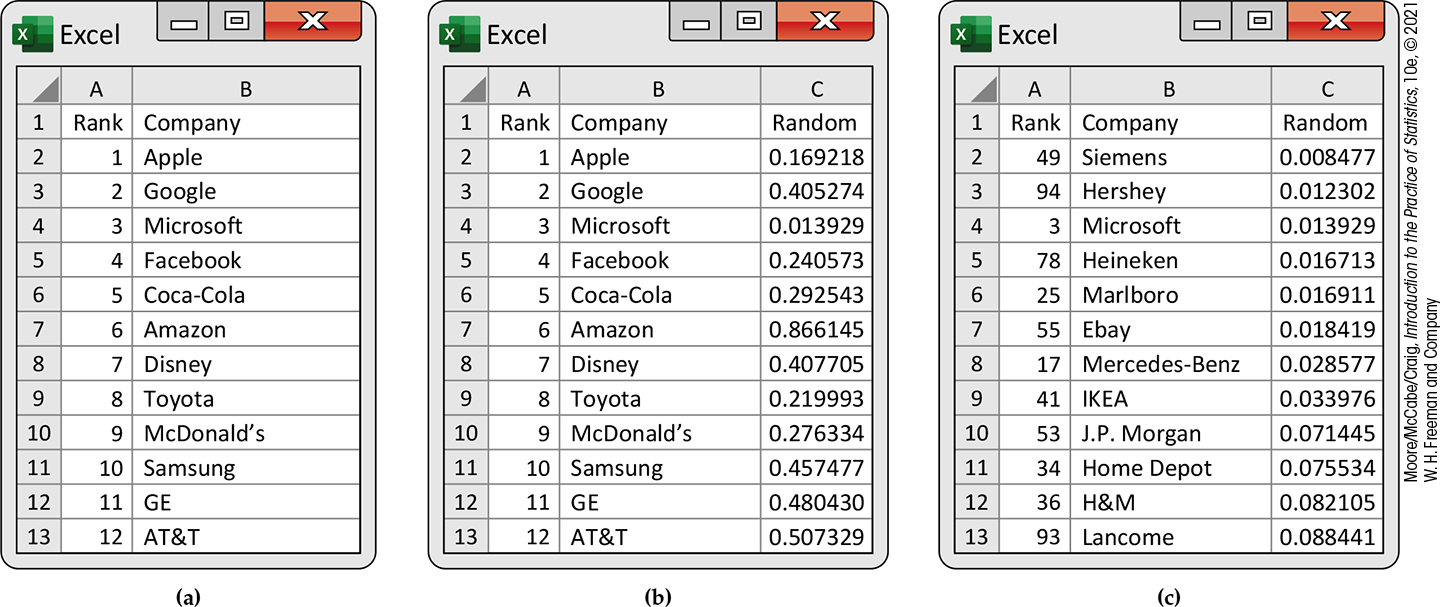
Figure 3.7 Selection of a simple random sample of brands, Example 3.34.
The random numbers generated by the RAND() function are given in the third column in Figure 3.7(b). The sorted data set is given in Figure 3.7(c). The 10 brands selected for our random sample are Siemens, Hershey, Microsoft, Heineken, Marlboro, Ebay, Mercedes-Benz, IKEA, J.P. Morgan, and Home Depot.
![]() Using the Simple Random Sample applet on the text website is
another convenient way to select an SRS.
Using the Simple Random Sample applet on the text website is
another convenient way to select an SRS.
Check-in
-
3.21 Select an SRS using Excel. Use Excel to select an SRS of eight brands from the BRANDS data file. Include a step-by-step detailed description of how you selected the brands.

Selection of a simple random sample using random digits
We illustrate the procedure by selecting an SRS of the top 100 brands using the BRANDS data set.
Example 3.35 Select an SRS of brands using random digits.
![]()
To select the sample by using Table B, we start with a list of the companies with the top 100 brands. This is given in the data file BRANDS. Next, we need to label the companies. In the data file they are listed with their ranks, 1 to 100. Let’s assign the labels 01 to 99 to the first 99 companies and 00 to the company with rank 100. Note that these labels are the same as the ranks of the brands with the exception that the 100th brand has the label 00. With these labels, we can use Table B to select the SRS.
Let’s start with line 156 of Table B. This line has the entries 55494 67690 88131 81800 11188 28552 25752 21953. These are grouped in sets of five digits, but we need to use sets of two digits for our randomization. Here is line 156 organized into sets of two digits: 55 49 46 76 90 88 13 18 18 00 11 18 82 85 52 25 75 22 19 53.
Using these random digits, we select Ebay (55), Siemens (49), CVS (46), LEGO (76), Philips (90), Huawei (88), IBM (13), and Oracle (18); we then skip the second 18 because we have already selected Oracle to be in our SRS; finally, we select Allianz (00, recoded from rank 100) and GE (11).
Check-in
-
3.22 Find the next three brands to be selected. Continue the process described in Example 3.35 to select the next three brands for the SRS. Show your work.
-
3.23 Listen to three hot songs. The walk to your statistics class takes about 10 minutes, about the amount of time needed to listen to three songs on your iPod or smartphone. You decide to take a simple random sample of songs from the top 10 listed on a Billboard Hot 100 Songs.19 Here is the list:
The Box Life Is Good Circles Memories Dance Monkey Don’t Start Now Roxanne Someone You Loved 10,000 Hours everything i wanted Select your three hot songs using a simple random sample. Show your work.
-
3.24 Listen to three Billboard songs. Refer to the previous Check-in question. Suppose that you like to include more variety in your music, so you look at the Billboard Top 200 songs.20 Here are the top 10 on this list:
Please Excuse Me Hollywood’s Bleeding Music to Be Murdered By Father of All When We All Fall Asleep, Where Do We Go Funeral Meet the Woo, V.2 Manic Kirk Lover
Select the three songs for your iPod or smartphone using a simple random sample. Show your work.
Example 3.36 Select an SRS of brands using JMP.
![]()
Refer to Example 3.34, where we selected an SRS of 10 brands from a population of 100 brands. Also see Example 3.35, where we used the random digits in Table B to select the SRS. We can also use JMP to select an SRS. The output for the first 10 brands selected is displayed in Figure 3.8. JMP provides a file with the selected brands with all columns in the original data file. Note that the selected files are listed in the order in which they appear in the original file.
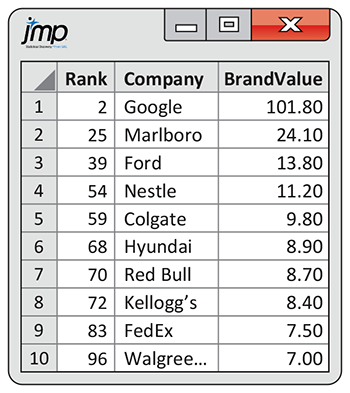
Figure 3.8 JMP output for selecting an SRS of 10 brands from a population of 100 brands, Example 3.36.
Stratified random samples
The general framework for designs that use chance to choose a sample is a probability sample.
Some probability sampling designs (such as an SRS) give each member of the population an equal chance to be selected. This may not be true in more elaborate sampling designs. In every case, however, the use of chance to select the sample is the essential principle of statistical sampling.
Designs for sampling from large populations spread out over a wide area are usually more complex than an SRS. For example, it is common to sample important groups within the population separately and then combine these samples. This is the idea of a stratified sample.
Choose the strata based on facts known before the sample is taken. For example, a population of election districts might be divided into urban, suburban, and rural strata.
A stratified design can produce more exact information than an SRS of the same size by taking advantage of the fact that individuals in the same stratum are similar to one another. Think of the extreme case in which all individuals in each stratum are identical: just one individual from each stratum is then enough to completely describe the population.
Strata for sampling are similar to blocks in experiments. We have two names for the same concept because the idea of grouping similar units before randomizing arose separately in sampling and in experiments.
Example 3.37 A stratified sample of brands.
In Examples 3.34 and 3.35, we selected SRSs of size 10 from the population of the top 100 brands. Let’s think about using a stratified sample. You still want to select 10 companies to examine in detail. But now you would like your sample to have 5 companies from the top 50 brands and 5 companies from the next 50 brands. So, we have two strata in our population: the top 50 brands and the next 50 brands. We take an SRS of size 5 from each of these strata.
Multistage random samples
Another common means of restricting random selection is to choose the sample in stages. This type of design is called a multistage design. This type of design is widely used in national samples of households or people. For example, data on employment and unemployment are gathered by the government’s Current Population Survey, which conducts interviews in about 60,000 households each month. The cost of sending interviewers to the widely scattered households in an SRS would be too high. Moreover, the government wants data broken down by states and large cities.
Example 3.38 The Current Population Survey.
The Current Population Survey uses a multistage design. The final sample consists of groups of nearby households, called clusters, that an interviewer can easily visit. Most opinion polls and other national samples are also multistage, though interviewing in most national samples today is done by telephone rather than in person, eliminating the economic need for clustering. The Current Population Survey sampling design is roughly as follows:21
-
Stage 1. Divide the United States into 2007 geographical areas called primary sampling units, or PSUs. PSUs do not cross state lines. Select a sample of 754 PSUs. This sample includes the 428 PSUs with the largest population and a stratified sample of 326 of the others.
-
Stage 2. Divide each PSU selected into smaller areas called blocks. Stratify the blocks using ethnic and other information and take a stratified sample of the blocks in each PSU.
-
Stage 3. Sort the housing units in each block into clusters of four nearby units. Interview the households in a probability sample of these clusters.
Analysis of data from sampling designs more complex than an SRS takes us beyond basic statistics. But the SRS is the building block of more elaborate designs, and analysis of other designs differs more in complexity of detail than in fundamental concepts.
Cautions about sample surveys
Random selection eliminates bias in the choice of a sample from a list of the population. Sample surveys of large human populations, however, require much more than a good sampling design.22 To begin, we need an accurate and complete list of the population. Because such a list is rarely available, most samples suffer from some degree of undercoverage. A sample survey of households, for example, will miss not only homeless people but also prison inmates and students in dormitories. An opinion poll conducted by telephone will miss the large number of American households without residential phones. The results of national sample surveys, therefore, have some bias if the people not covered—who most often are poor people—differ from the rest of the population.
A more serious source of bias in most sample surveys is nonresponse, which occurs when a selected individual cannot be contacted or refuses to cooperate. Nonresponse to sample surveys often reaches 50% or more, even with careful planning and several callbacks. Because nonresponse is especially high in urban areas, most sample surveys substitute other people in the same area to avoid favoring rural areas in the final sample. If the people contacted differ from those who are rarely at home or who refuse to answer questions, some bias remains.
Example 3.39 Nonresponse in the Current Population Survey.
How bad is nonresponse? The Current Population Survey (CPS) is one of the oldest, largest, and most well-recognized surveys in the United States (Figure 3.9). The nonresponse rate for the CPS is about 17%.23 People are more likely to respond to a government survey such as the CPS, and the CPS contacts its sample in person before doing later interviews by phone.
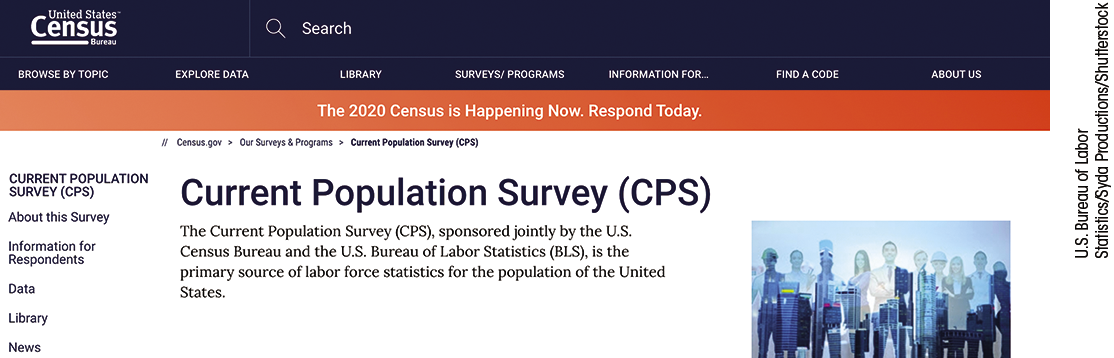
Figure 3.9 Part of the home page for the Current Population Survey (CPS). The CPS surveys about 60,000 households each month.
The General Social Survey (GSS) is the nation’s most important social science research survey. The GSS also contacts its sample in person, and it is run by a university. Despite these advantages, its most recent survey had a 38.7% rate of nonresponse.24
What about polls done by the media and by market research and opinion-polling firms? Often, we don’t know their rates of nonresponse because they won’t say. That itself is a bad sign.
Example 3.40 Change in nonresponse in Pew surveys.
The Pew Research Center conducts research using surveys on a variety of issues, attitudes, and trends.25 A study by the center examined the decline in the response rates to Pew surveys over time. The changes are dramatic, and there is a consistent pattern over time. Here are some data from the report:26
| Year | 1997 | 2005 | 2009 | 2013 | 2018 |
| Nonresponse rate | 64% | 75% | 85% | 91% | 94% |
The center is devising alternative methods that show some promise of improving the response rates of Pew surveys.
Most sample surveys, and almost all opinion polls, are now carried out by telephone. This and other details of the interview method can affect the results. When presented with several options for a reply, such as “completely agree,” “mostly agree,” “mostly disagree,” and “completely disagree,” people tend to be a little more likely to respond to the first one or two options presented.
The behavior of the respondent or of the interviewer can lead to response bias in sample results. Respondents may lie, especially if asked about illegal or unpopular behavior. The race or sex of the interviewer can influence responses to questions about race relations or attitudes toward feminism. Answers to questions that ask respondents to recall past events are often inaccurate because of faulty memory. For example, many people “telescope” events in the past, bringing them forward in memory to more recent time periods. “Have you visited a dentist in the past six months?” will often elicit a Yes from someone who last visited a dentist eight months ago.
The wording of questions is the most important influence on the answers given to a sample survey. Confusing or leading questions can introduce strong bias, and even minor changes in wording can change a survey’s outcome. Here are some examples.
Example 3.41 The form of the question is important.
Do you exercise regularly and eat a healthy diet? This is a double-barreled question. A Yes answer should mean that the person does both things: exercises regularly and eats a healthy diet. Many respondents would do only one of these things and would be confused by the question. A good practice is to avoid double-barreled questions and ask two separate questions to obtain the desired information.
The statistical design of sample surveys is a science, but this
science is only part of the art of sampling. Because of nonresponse,
response bias, and the difficulty of wording clear and neutral
questions, you should hesitate to fully trust reports about
complicated issues based on surveys of large human populations.
![]() Insist on knowing the exact questions asked, the rate of
nonresponse, and the date and method of the survey before you trust
a poll’s result.
Insist on knowing the exact questions asked, the rate of
nonresponse, and the date and method of the survey before you trust
a poll’s result.
Example 3.42 Estimate the number of least flycatchers using capture-recapture.

You are interested in the number of least flycatchers migrating along a major route in the north-central United States. You set up “mist nets” that capture the birds but do not harm them. The birds caught in a net are fitted with a small aluminum leg band and released. Last year, you banded and released 200 least flycatchers. This year, you repeat the process. Your net catches 120 least flycatchers, 12 of which have tags from last year’s catch.
The proportion of your second sample that have bands should estimate the proportion in the entire population that are banded. So if N is the unknown number of least flycatchers, we should have approximately
Solve for N to estimate that the total number of flycatchers migrating while your net was up this year is approximately
The capture-recapture idea extends the use of a sample proportion to estimate a population proportion. The idea works well if both samples are SRSs from the population and the population remains unchanged between samples. In practice, complications arise because, for example, some of the birds tagged last year died before this year’s migration.
Variations on capture-recapture samples are widely used in wildlife studies and are now finding other applications. One way to estimate the census undercount in a district is to consider the census as “capturing and marking” the households that respond. Census workers then visit the district, take an SRS of households, and see how many of those counted by the census show up in the sample. Capture-recapture estimates the total count of households in the district. As with estimating wildlife populations, there are many practical pitfalls. Our final word is as before: the real world is less orderly than statistics textbooks imply.
Section 3.3 SUMMARY
-
A sample survey selects a sample from the population of all individuals about which we desire information. We base conclusions about the population on data about the sample.
-
The sample design refers to the method used to select the sample from the population. Probability sample designs use impersonal chance to select a sample.
-
The basic probability sample is a simple random sample (SRS). An SRS gives every possible sample of a given size the same chance to be chosen.
-
Choose an SRS using software. This can also be done using a table of random digits to select the sample.
-
To choose a stratified random sample, divide the population into strata, groups of individuals that are similar in some way that is important to the response. Then choose a separate SRS from each stratum and combine them to form the full sample.
-
Multistage samples select successively smaller groups within the population in stages, resulting in a sample consisting of clusters of individuals. Each stage may employ an SRS, a stratified sample, or another type of sample.
-
Failure to use probability sampling often results in bias, or systematic errors in the way the sample represents the population.
-
Voluntary response samples, in which the respondents choose themselves, are particularly prone to large bias.
-
In human populations, even probability samples can suffer from bias due to undercoverage or nonresponse, from response bias due to the behavior of the interviewer or the respondent, or from misleading results due to poorly worded questions.
Section 3.3 EXERCISES
-
3.26 How many text messages? You would like to know something about how many text messages you will receive in the next 50 days. Counting the number for each of the 50 days would take more time than you would like to spend on this project, so you randomly select 5 days from the 50 to count.
Describe the population for this setting.
What is the sample?
-
3.27 Response rate. A survey designed to assess satisfaction with food items sold at a college’s football games was sent to 100 fans who had season tickets. The total number of fans who have season tickets is 6874. Responses to the survey were received from 62 fans.
Describe the population for this survey.
What is the sample?
What is the response rate?
What is the nonresponse rate?
-
Suggest some methods that could be used in a future survey to increase the response rate.
-
3.28 Interview some students. You are a teaching assistant for an introductory statistics class. The instructor would like you to interview some of the students in the class to find out their opinions regarding the new interactive activities that she has introduced to the course. There are 33 students in the class, and you cannot interview all of them. You decide to select 7 students to interview.
What is the population for this setting?
What is the sample?
-
Make a spreadsheet with the numeric labels for the 33 students in the class.
-
Use Excel to select the labels of the 7 students to be interviewed from the spreadsheet.
-
Explain the steps that you used in sufficient detail so that another person could repeat your work.
-
3.29 Select the students to be interviewed. Refer to the previous exercise.
-
3.30 What’s wrong? Explain what is wrong in each of the following scenarios.
-
The population consists of all individuals selected in a simple random sample.
-
In a poll of an SRS of residents in a local community, respondents are asked to indicate the level of their concern about the dangers of dihydrogen monoxide, a substance that is a major component of acid rain and that, in its gaseous state, can cause severe burns. (Hint: Ask a friend who is majoring in chemistry about this substance or search the Internet for information about it.)
-
Students in a class are asked to raise their hands if they have cheated on an exam one or more times within the past year.
-
-
3.31 What kind of sample? In each of the following situations, identify the sample as an SRS, a stratified random sample, a multistage random sample, or a voluntary response sample. Explain your answers.
-
A student organization has 45 members. A table of random digits is used to select a sample of 4.
-
An online poll asks people who visit this site to choose their favorite television show.
-
Separate random samples of male and female first-year college students in an introductory psychology course are selected to receive a one-week alternative instructional method.
-
There are eight sections of an introductory statistics course. A random sample of two sections is chosen, and then random samples of eight students from each of these sections are chosen.
-
-
3.32 What’s wrong? Explain what is wrong with each of the following random selection procedures and explain how you would do the randomization correctly.
-
To determine the reading level of an introductory statistics text, you evaluate all the written material in the third chapter.
-
You want to sample student opinions about a proposed change in procedures for changing majors. You hand out questionnaires to 100 students as they arrive for class at 7:30 a.m.
-
A population of subjects is put in alphabetical order, and a simple random sample of size 10 is taken by selecting the first 10 subjects from the list.
-
-
3.33 Importance of students as customers. A committee on community relations in a college town plans to survey local businesses about the importance of students as customers. From telephone book listings, the committee chooses 70 businesses at random. Of these, 26 return the questionnaire mailed by the committee.
What is the population for this sample survey?
What is the sample?
What is the rate (percent) of nonresponse?
-
3.34 Identify the populations. For each of the following sampling situations, identify the population as exactly as possible. That is, say what kind of individuals the population consists of and say exactly which individuals fall in the population. If the information given is not complete, complete the description of the population in a reasonable way.
-
A college has changed its core curriculum and wants to obtain detailed feedback information from the students during each of the first 12 weeks of the coming semester. Each week, a random sample of five students will be selected to be interviewed.
-
The American Community Survey (ACS) replaced the census “long form” starting with the 2010 census. The ACS contacts 250,000 addresses by mail each month, with follow-up by phone and in person if there is no response. Each household answers questions about its housing, economic, and social status.
-
An opinion poll contacts 1161 adults and asks them, “Which political party do you think has better ideas for leading the country in the twenty-first century?”
-
-
3.35 Interview residents of apartment complexes. You are planning a report on apartment living in a college town. You decide to select eight apartment complexes at random for in-depth interviews with residents. Select a simple random sample of eight of the following apartment complexes. If you use Table B, start at line 136.

Ashley Oaks Country View Mayfair Village Bay Pointe Country Villa Nobb Hill Beau Jardin Crestview Pemberly Courts Bluffs Del-Lynn Peppermill Brandon Place Fairington Pheasant Run Briarwood Fairway Knolls Richfield Brownstone Fowler Sagamore Ridge Burberry Franklin Park Salem Courthouse Cambridge Georgetown Village Manor Chauncey Village Greenacres Waterford Court Country Squire Lahr House Williamsburg -
3.36 Using GIS to identify mint field conditions. A geographic information system (GIS) is to be used to distinguish different conditions in mint fields. Ground observations will be used to classify regions of each field as either healthy mint, diseased mint, or weed-infested mint. The GIS divides mint-growing areas into regions called pixels. An experimental area contains 100 pixels. For a random sample of 12 pixels, ground measurements will be made to determine the status of the mint, and these observations will be compared with information obtained by the GIS. Select the random sample. If you use Table B, start at line 130 and choose only the first 12 pixels in the sample.
-
 3.37 Select a simple random sample.
After you have labeled the individuals in a population, the
Simple Random Sample applet automates the task of
choosing an SRS. Use the applet to choose the sample in the
previous exercise.
3.37 Select a simple random sample.
After you have labeled the individuals in a population, the
Simple Random Sample applet automates the task of
choosing an SRS. Use the applet to choose the sample in the
previous exercise.
-
3.38 Select another simple random sample. There
are 38 active telephone area codes in California. You want to
choose an SRS of 8 of these area codes for a study of available
telephone numbers. Label the codes 01 to 38 and use the
Simple Random Sample applet,
Table B, or software to choose your sample. (If you use
Table B, start at line 125.)
-
 3.39 Stratified samples for attitudes about alcohol.
At a party, there are 30 students over age 21 and 20 students
under age 21. You choose at random 6 of those over 21 and
separately choose at random 4 of those under 21 to interview
about attitudes toward alcohol. You have given every student at
the party the same chance to be interviewed. What is that
chance? Why is your sample not an SRS?
3.39 Stratified samples for attitudes about alcohol.
At a party, there are 30 students over age 21 and 20 students
under age 21. You choose at random 6 of those over 21 and
separately choose at random 4 of those under 21 to interview
about attitudes toward alcohol. You have given every student at
the party the same chance to be interviewed. What is that
chance? Why is your sample not an SRS?
-
3.40 Systematic random samples. Systematic random samples are often used to choose a sample of apartments in a large building or dwelling units in a block at the last stage of a multistage sample. An example will illustrate the idea of a systematic sample. Suppose that we must choose 5 addresses out of 125. Because
-
A study of dating among college students wanted a sample of 200 of the 8000 single male students on campus. The sample consisted of every 40th name from a list of the 8000 students. Explain why the survey chooses every 40th name.
-
Use software or Table B at line 112 to choose the starting point for this systematic sample.
-
-
3.41 Systematic random samples versus simple random
samples.
The previous exercise introduces systematic random samples.
Explain carefully why a systematic random sample
does give every individual the same chance to be chosen
but is not a simple random sample.
-
3.42 Random digit telephone dialing. An opinion poll in California uses random digit dialing to choose telephone numbers at random. Numbers are selected separately within each California area code. The size of the sample in each area code is proportional to the population living there.

-
What is the name for this kind of sampling design?
-
California area codes, in rough order from north to south, are
209 213 310 323 341 369 408 415 424 442 510 530 559 562 619 626 627 628 650 657 661 669 707 714 747 752 760 764 805 818 831 858 909 916 925 935 949 951 Another California survey does not call numbers in all area codes but starts with an SRS of six area codes. Choose such an SRS. If you use Table B, start at line 122.
-
-
3.43 Select club members to go to a convention. A club has 30 student members and 10 faculty members. The students are
Abel Fisher Huber Moran Reinmann Carson Golomb Jimenez Moskowitz Santos Chen Griswold Jones Neyman Shaw David Hein Kiefer O’Brien Thompson Deming Hernandez Klotz Pearl Utts Elashoff Holland Liu Potter Vlasic and the faculty members are
Andrews Fernandez Kim Moore Rabinowitz Besicovitch Gupta Lightman Phillips Yang The club can send 7 students and 3 faculty members to a convention and decides to choose those who will go by random selection. Select a stratified random sample of 7 students and 3 faculty members.
-
3.44 Stratified samples for accounting audits. Accountants use stratified samples during audits to verify a company’s records of such things as accounts receivable. The stratification is based on the dollar amount of the item and often includes 100% sampling of the largest items. One company reports 5000 accounts receivable. Of these, 100 are in amounts over $50,000; 500 are in amounts between $1000 and $50,000; and the remaining 4400 are in amounts under $1000. Using these groups as strata, you decide to verify all of the largest accounts and to sample 5% of the midsize accounts and 1% of the small accounts. How would you label the two strata from which you will sample? Use software or Table B, starting at line 125, to select the first 6 accounts from each of these strata.
-
3.45 The sampling frame. The list of individuals from which a sample is actually selected is called the sampling frame. Ideally, the frame should list every individual in the population, but in practice this is often difficult. A common source of undercoverage is frames leaving out part of the population.
-
Suppose that a sample of households in a community is selected at random from the telephone directory. What households are omitted from this frame? What types of people do you think are likely to live in these households? These people will probably be underrepresented in the sample.
-
It is usual in telephone surveys to use random digit dialing equipment that selects the last four digits of a telephone number at random after being given the area code and the exchange. The exchange is the first three digits of the telephone number. Which of the households that you mentioned in your answer to part (a) will be included in the sampling frame by random digit dialing?
-
-
3.46 Survey questions. Comment on each of the following as a potential sample survey question. Is the question clear? Is it slanted toward a desired response?
-
“Some cell phone users have developed brain cancer. Should all cell phones come with a warning label explaining the danger of using cell phones?”
-
“Do you agree that a national system of health insurance should be favored because it would provide health insurance for everyone and would reduce administrative costs?”
-
“In view of escalating environmental degradation and incipient resource depletion, would you favor economic incentives for recycling of resource-intensive consumer goods?”
-