6.3 Use and Abuse of Tests
Carrying out a test of significance is often quite simple, especially if the P-value is given effortlessly by a computer. Using tests wisely is not so simple. Each test is valid only in certain circumstances, and properly produced data is particularly important.
The z test, for example, should bear the same warning label that was attached in Section 6.1 to the corresponding confidence interval (page 341). Similar warnings accompany the other tests that we will learn. There are additional caveats that concern significance tests more than confidence intervals enough to warrant this separate section. Some hesitation about the unthinking use of significance tests is a sign of statistical maturity.
The reasoning of significance tests has appealed to researchers in
many fields, and tests are widely used to report research results. In
this setting
Choosing a level of significance
The intention of a significance test is to give a clear statement of
the degree of evidence provided by the sample against the null
hypothesis. The P-value does this. It is common practice,
however, to describe the results in terms of statistical significance
(i.e., whether
![]() This is because
there is no sharp border between “significant” and “not
significant”; there is only increasingly strong evidence as the
P-value decreases.
Including the P-value with a description of the detected effect
allows for a much clearer conclusion.
This is because
there is no sharp border between “significant” and “not
significant”; there is only increasingly strong evidence as the
P-value decreases.
Including the P-value with a description of the detected effect
allows for a much clearer conclusion.
Example 6.21 Information provided by the P-value.
Suppose that the test statistic for a two-sided significance test
for a population mean is
We have failed to meet the standard of evidence for
Here is another example where the P-value provides useful information beyond that provided by the statement that we reject or fail to reject the null hypothesis.
Example 6.22 More on information provided by the P-value.
We have a test statistic of
One reason for the common use of
Recently, certain scientific communities, which have historically used
These arguments suggest that the choice of
What statistical significance does not mean
When a null hypothesis (“no effect” or “no difference”) can be
rejected at the usual level
![]() When large samples are available, even tiny deviations from the
null hypothesis will be statistically significant.
In the era of big data, this is particularly important to keep in
mind.
When large samples are available, even tiny deviations from the
null hypothesis will be statistically significant.
In the era of big data, this is particularly important to keep in
mind.
Example 6.23 It’s significant, but is it important?
Suppose that we are testing the null hypothesis of no correlation
between two variables. With 400 observations, an observed
correlation of only
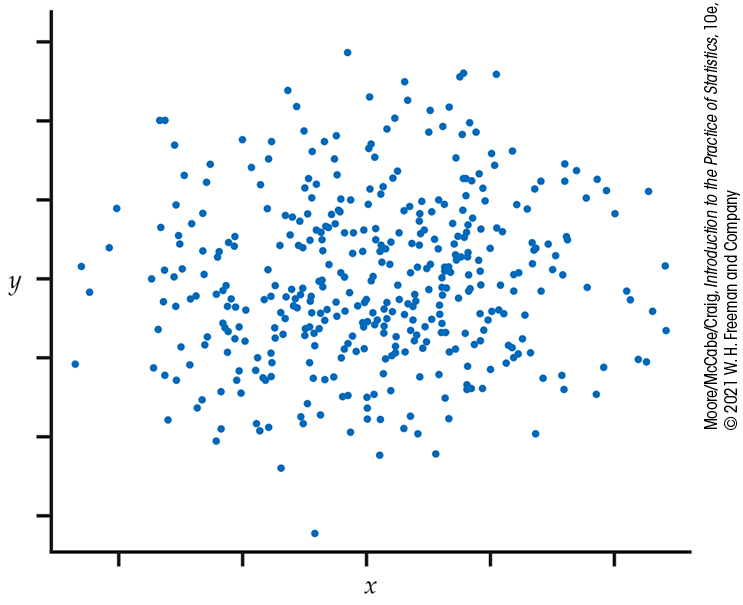
Figure 6.15 Scatterplot of
For practical purposes, we might well decide to ignore this
association.
![]() Statistical significance is not the same as practical
significance.
Statistical significance rarely tells us about the importance of the
experimental results. This depends on subject-matter knowledge and the
context of the experiment.
Statistical significance is not the same as practical
significance.
Statistical significance rarely tells us about the importance of the
experimental results. This depends on subject-matter knowledge and the
context of the experiment.
The remedy for attaching too much importance to statistical
significance is to pay attention to the actual experimental results as
well as to the P-value. Plot your data and examine them
carefully. Beware of outliers.
![]() The user of statistics who feeds the data to a computer without
exploratory analysis will often be embarrassed.
It is usually wise to give a confidence interval for the parameter in
which you are interested. Confidence intervals are not used as often
as they should be, while tests of significance are overused.
The user of statistics who feeds the data to a computer without
exploratory analysis will often be embarrassed.
It is usually wise to give a confidence interval for the parameter in
which you are interested. Confidence intervals are not used as often
as they should be, while tests of significance are overused.
Check-in

-
6.26 Is it significant? More than 200,000 people worldwide take the GMAT examination each year when they apply for MBA programs. Their scores vary Normally with mean
in each of the following situations.
-
The students’ average score is
-
Now suppose that the average score is
-
Explain how you would reconcile this difference in significance, especially if any increase greater than 15 points is considered a success.
-
Don’t ignore lack of significance
There is a tendency to conclude that there is no effect whenever a P-value fails to attain the usual 5% standard. A provocative editorial in the British Medical Journal titled “Absence of Evidence Is Not Evidence of Absence” deals with this issue.24 Here is one of the examples this editorial cites.
Example 6.24 Interventions to reduce HIV-1 transmission.
A randomized trial of interventions for reducing transmission of HIV-1 reported an incident rate ratio of 1.00, meaning that the intervention group and the control group both had the same rate of HIV-1 infection. The 95% confidence interval was reported as 0.63 to 1.58.25 The editorial notes that a summary of these results that says the intervention has no effect on HIV-1 infection is misleading. The confidence interval indicates that the intervention may be capable of achieving a 37% decrease in infection; it might also be harmful and produce a 58% increase in infection. Clearly, more data are needed to distinguish between these possibilities.
The situation can be worse. Research in some fields has rarely been published unless significance at the 0.05 level is attained.
Example 6.25 Journal survey of reported significance results.
A survey of four journals published by the American Psychological Association showed that of 294 articles using statistical tests, only eight reported results that did not attain the 5% significance level.26 It is very unlikely that these were the only eight studies of scientific merit that did not attain significance at the 0.05 level. Manuscripts describing other studies were likely rejected because of a lack of statistical significance or never submitted in the first place due to the expectation of rejection.
In some areas of research, small effects that are detectable only with large sample sizes can be of great practical significance. Data accumulated from a large number of patients taking a new drug may be needed before we can conclude that there are life-threatening consequences for a small number of people.
On the other hand, sometimes a meaningful result is not found to be significant.
Example 6.26 A meaningful but statistically insignificant result.
A sample of size 10 gave a correlation of
![]() Another important aspect of planning a study is to verify that the
test you plan to use does have high probability of detecting an
effect of the size you hope to find.
This probability is the power of the test. Power calculations
are discussed in
Section 7.3
and elsewhere for particular data analysis procedures.
Another important aspect of planning a study is to verify that the
test you plan to use does have high probability of detecting an
effect of the size you hope to find.
This probability is the power of the test. Power calculations
are discussed in
Section 7.3
and elsewhere for particular data analysis procedures.
Statistical inference is not valid for all sets of data
In Chapter 3 , we
learned that badly designed surveys or experiments often produce
invalid results.
![]() Formal statistical inference cannot correct basic flaws in the
design.
Formal statistical inference cannot correct basic flaws in the
design.
Example 6.27 English vocabulary and studying a foreign language.
There is no doubt that there is a significant difference in English vocabulary scores between high school seniors who have studied a foreign language and those who have not. But because the effect of actually studying a language is confounded with the differences between students who choose language study and those who do not, this statistical significance is hard to interpret. The most plausible explanation is that students who were already good at English chose to study another language. A randomized comparative experiment would isolate the actual effect of language study and so make significance meaningful. Do you think it is ethical to do such a study?
Tests of significance and confidence intervals are based on the laws
of probability. Randomization in sampling or experimentation ensures
that these laws apply. But we must often analyze data that do not
arise from randomized samples or experiments.
![]() To apply statistical inference to such data, we must have
confidence in a probability model for the data.
The diameters of successive holes bored in auto engine blocks during
production, for example, may behave like independent observations from
a Normal distribution. We can check this probability model by
examining the data. If the Normal distribution model appears
approximately correct, we can apply the methods of this chapter to do
inference about the process mean diameter
To apply statistical inference to such data, we must have
confidence in a probability model for the data.
The diameters of successive holes bored in auto engine blocks during
production, for example, may behave like independent observations from
a Normal distribution. We can check this probability model by
examining the data. If the Normal distribution model appears
approximately correct, we can apply the methods of this chapter to do
inference about the process mean diameter
Check-in
-
6.27 Home security systems. A recent TV advertisement for home security systems said that homes without an alarm system are three times more likely to be broken into. Suppose that this conclusion was obtained by examining an SRS of police records of break-ins and determining whether the percent of homes with alarm systems was significantly smaller than 50%. Explain why the significance of this study is suspect and propose an alternative study that would help clarify the importance of an alarm system.
Beware of searching for significance
Statistical significance is an outcome much desired by researchers.
It means (or ought to mean) that you have found an effect that you
were looking for.
![]() The reasoning behind statistical significance works well if you
decide what effect you are seeking, design an experiment or sample
to search for it, and use a test of significance to weigh the
evidence you get.
But because a successful search for a new scientific phenomenon often
ends with statistical significance, it is all too tempting to make
significance itself the object of the search. There are several ways
to do this, none of them acceptable in polite scientific society.
The reasoning behind statistical significance works well if you
decide what effect you are seeking, design an experiment or sample
to search for it, and use a test of significance to weigh the
evidence you get.
But because a successful search for a new scientific phenomenon often
ends with statistical significance, it is all too tempting to make
significance itself the object of the search. There are several ways
to do this, none of them acceptable in polite scientific society.
Example 6.28 Genomics studies.
In genomics experiments, it is common to assess the differences in expression for tens of thousands of genes. If each of these genes were examined separately and statistical significance declared for all that had P-values that pass the 0.05 standard, we would have quite a mess. In the absence of any real biological effects, we would expect that, by chance alone, approximately 5% of these tests would show statistical significance. Much research in genomics is directed toward appropriate ways to deal with this situation.27
We do not mean that searching data for suggestive patterns is not
proper scientific work. It certainly is. Many important discoveries
have been made by accident rather than by design. Exploratory analysis
of data is an essential part of statistics. We do mean that the usual
reasoning of statistical inference does not apply when the search for
a pattern is successful.
![]() You cannot legitimately test a hypothesis on the same data that
first suggested that hypothesis.
The remedy is clear. Once you have a hypothesis, design a study to
search specifically for the effect you now think is there. If the
result of this study is statistically significant, you have real
evidence.
You cannot legitimately test a hypothesis on the same data that
first suggested that hypothesis.
The remedy is clear. Once you have a hypothesis, design a study to
search specifically for the effect you now think is there. If the
result of this study is statistically significant, you have real
evidence.
Section 6.3 SUMMARY
-
P-values are more informative than the reject-or-not result of a level
-
Very small effects can be highly significant (small P), especially when a test is based on a large sample. A statistically significant effect need not have practical significance. Always plot the data to display the effect you are seeking, and use confidence intervals to estimate the actual values of parameters.
-
Lack of significance does not imply that
-
Significance tests are not always valid. Faulty data collection, outliers in the data, and testing a hypothesis on the same data that suggested the hypothesis can invalidate a test.
-
Many tests run at once will probably produce some significant results by chance alone, even if all the null hypotheses are true.
Section 6.3 EXERCISES
-
6.60 What other information is needed? An observational study that involved
-
6.61 What do you know? A research report described two results that both achieved statistical significance at the 5% level. The P-value for the first is 0.048; for the second it is 0.0002. Do the P-values add any useful information beyond that conveyed by the statement that both results are statistically significant? Write a short paragraph explaining your views on this question.
-
6.62 Selective publication based on results. In addition to statistical significance, selective publication can also be due to the observed outcome. A review of 74 studies of antidepressant agents found 38 studies with positive results and 36 studies with negative or questionable results. All but 1 of the 38 positive studies were published. Of the remaining 36, 22 were not published, and 11 were published in such a way as to convey a positive outcome.28 Describe how such selective reporting can have adverse consequences on health care.
-
6.63 What a test of significance can answer. Explain whether a test of significance can answer each of the following questions.
Is the sample or experiment properly designed?
-
Is the observed effect compatible with the null hypothesis?
Is the observed effect important?
-
6.64 Vitamin C and colds. In a study to investigate whether vitamin C prevents colds, 400 subjects are assigned at random to one of two groups. The experimental group takes a vitamin C tablet daily, while the control group takes a placebo. At the end of the experiment, the researchers calculate the difference between the percents of subjects in the two groups who were free of colds. This difference is statistically significant
-
6.65 How far do rich parents take us? How much education children get is strongly associated with the wealth and social status of their parents, termed “socioeconomic status,” or SES. The SES of parents, however, has little influence on whether children who have graduated from college continue their education. One study looked at whether college graduates took the graduate admissions tests for business, law, and other graduate programs. The effects of the parents’ SES on taking the LSAT test for law school were “both statistically insignificant and small.”
What does “statistically insignificant” mean?
-
Why is it important that the effects were small in size as well as statistically insignificant?
-
6.66 Do you agree? State whether or not you agree with each of the following statements and provide a short summary of the reasons for your answers.
-
If the P-value is larger than 0.05, the null hypothesis is true.
-
Practical significance is not the same as statistical significance.
-
We can perform a statistical analysis using any set of data.
-
If you find an interesting pattern in a set of data, it is appropriate to then use a significance test to determine its significance.
-
It’s always better to use a significance level of
-
-
6.67 Practical significance and sample size. Every user of statistics should understand the distinction between statistical significance and practical importance. A sufficiently large sample will declare very small effects statistically significant. Consider the study of elite female Canadian athletes in Exercise 6.44 (page 366). Female athletes were consuming an average of 2403.7 kcal/d with a standard deviation of 880 kcal/d. Suppose that a nutritionist is brought in to implement a new health program for these athletes. This program should increase mean caloric intake but not change the standard deviation. Given the standard deviation and how calorie deficient these athletes are, a change in the mean of 50 kcal/d to 2453.7 is of little importance. However, with a large enough sample, this change can be significant. To see this, calculate the P-value for the test of
in each of the following situations:
-
A sample of 100 athletes; their average caloric intake is
-
A sample of 500 athletes; their average caloric intake is
-
A sample of 2500 athletes; their average caloric intake is
-
-
6.68 Statistical versus practical significance. A study with 7500 subjects reported a result that was statistically significant at the 5% level. Explain why this result might not be particularly important.
-
6.69 More on statistical versus practical significance. A study with 14 subjects reported a result that failed to achieve statistical significance at the 5% level. The P-value was 0.051. Write a short summary of how you would interpret these findings.
-
 6.70 Find journal articles. Find two journal
articles that report results with statistical analyses. For each
article, summarize how the results are reported and write a
critique of the presentation. Be sure to include details
regarding use of significance testing at a particular level of
significance, P-values, and confidence intervals.
6.70 Find journal articles. Find two journal
articles that report results with statistical analyses. For each
article, summarize how the results are reported and write a
critique of the presentation. Be sure to include details
regarding use of significance testing at a particular level of
significance, P-values, and confidence intervals.
-
6.71 Drug treatment to stop smoking. A company matches 200 smokers who signed up for the company’s drug treatment with 200 smokers from the general population. Matching was done on length of smoking, number of packs per day, age, and sex. The company then followed the smokers for six months and recorded whether they quit smoking. The company concludes its drug treatment increases the chance of quitting smoking by 50%
-
6.72 Predicting success of trainees. What
distinguishes managerial trainees who eventually become
executives from those who, after expensive training, don’t
succeed and leave the company? We have abundant data on past
trainees—data on their personalities and goals, their college
preparation and performance, and even their family backgrounds
and hobbies. Statistical software makes it easy to perform
dozens of significance tests on these dozens of variables to see
which ones best predict later success. We find that future
executives are significantly more likely than washouts to have
an urban or suburban upbringing and an undergraduate degree in a
technical field.
Explain clearly why using these “significant” variables to select future trainees is not wise. Then suggest a follow-up study using this year’s trainees as subjects that should clarify the importance of the variables identified by the first study.
-
6.73 Searching for significance. A research team is looking for risk factors associated with Alzheimer’s disease. The team has decided to investigate roughly 500 different factors, testing each at the
-
6.74 More on searching for significance. You perform 1000 significance tests using
-
6.75 Interpreting a very small P-value. Assume that you are performing a large number of significance tests. Let n be the number of these tests. How large would n need to be for you to expect about one P-value to be 0.00001 or smaller? Use this information to write an explanation of how to interpret a result that has
-
6.76 An adjustment for multiple tests. One way
to deal with the problem of misleading P-values when
performing more than one significance test is to adjust the
criterion you use for statistical significance. The
Bonferroni method does this in a simple way. If
you perform two tests and want to use the
-
6.77 Significance using the Bonferroni procedure.
Refer to the previous exercise. A researcher has performed 12
tests of significance and wants to apply the Bonferroni
procedure with