Chapter 6 Introduction to Inference

Introduction
Statistical inference draws conclusions about a population or process from sample data. It also provides a statement of how much confidence we can place in our conclusions. Although there are numerous methods for inference, there are only a few general types of statistical inference. This chapter introduces the two most common types: confidence intervals and tests of significance. They can be used to answer questions such as the following:
- How are trees spatially distributed in a forest? Using the locations of hundreds of trees in an undisturbed forest region, can we conclude they are not randomly distributed?
- Based on an SRS of 2000 families from the United States, what is the average amount from college savings plans that U.S. families use to pay for a year of college?
- Based on this same sample, can we conclude that the average grant and scholarship amounts differ between students who take out loans to pay for college and students who do not take out loans?
Because the underlying reasoning for these two types of inference
remains the same across different settings, this chapter considers
just one simple
setting that is closely related to our study of the sampling
distributions of
Later chapters present inference methods to use in most of the settings we met in learning to explore data. In fact, there are libraries—both of books and of computer software—full of more elaborate statistical techniques. Informed use of any of these methods, however, requires a firm understanding of the underlying reasoning. That is the goal of this chapter. A computer or calculator will do the arithmetic, but you must exercise sound judgment based on understanding.
Overview of inference
The purpose of statistical inference is to draw conclusions from data. Formal inference emphasizes substantiating our conclusions via probability calculations. Probability allows us to take chance variation into account. Here is an example.
Example 6.1 Clustering of trees in a forest.
![]()
The Wade Tract in Thomas County, Georgia, is an old-growth forest of longleaf pine trees (Pinus palustris) that has survived in a relatively undisturbed state since before the settlement of the area by Europeans. Foresters who study these trees are interested in how the trees are distributed in the forest. Is there some sort of clustering, resulting in regions of the forest with more trees than others? Or are the tree locations random, resulting in no particular patterns? Figure 6.1 gives a plot of the locations of all 584 longleaf pine trees in a 200-meter by 200-meter region in the Wade Tract.1
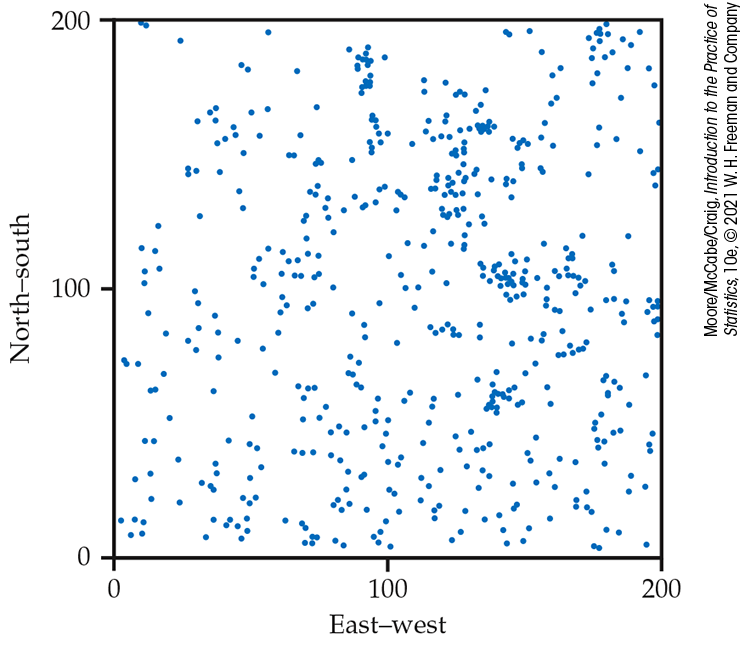
Figure 6.1 The distribution of longleaf pine trees, Example 6.1.
Do the locations appear to be random, or do there appear to be clusters of trees? One approach to the analysis of these data indicates that a pattern as clustered as, or more clustered than, the one in Figure 6.1 would occur only 4% of the time if, in fact, the locations of longleaf pine trees in the Wade Tract are random. Because this chance is fairly small, we conclude that there is some clustering of these trees.
This probability calculation helps us to distinguish between patterns that are consistent or inconsistent with the random location scenario. We did a similar probability calculation in Example 5.21 (page 303) when we compared the proportion of students in your dormitory who vape to the proportion of high school seniors who vape. Here is another example assessing a new oral antibiotic for acne—with a different conclusion.
Example 6.2 Effectiveness of a new oral antibiotic.
Researchers want to know if a new oral antibiotic is more effective in relieving acne than a popular topical (on the skin) antibiotic. Twenty patients are randomly assigned to receive the oral medication, and another 20 receive the topical medication. Fifteen (75%) of those taking the oral medication find satisfactory symptom relief versus 11 (55%) of the topical medication patients.
Our unaided judgment suggests that the oral medication is better, 75% to 55%. However, probability calculations tell us that a difference this large or larger between the results in the two groups of 20 patients would occur about one time in five simply because of chance variation. In this case, it is better to conclude that the data fail to establish a real difference between the two treatments. This probability (nearly 0.19) is too large to ignore.
These two examples are tests of significance, which assess the evidence for a claim. Prior to detailing these tests in Section 6.2, we discuss confidence intervals for estimating the value of a population parameter. Both types of inference are based on the sampling distributions of statistics. That is, both report probabilities that state what would happen if we used the inference method many times. This kind of probability statement is characteristic of standard statistical inference. Users of statistics must understand the nature of this reasoning and the meaning of the probability statements that appear in journal articles, science blogs, and statistical software output.
Because the methods of formal inference are based on sampling distributions, they require a probability model for the data. Trustworthy probability models can arise in many ways, but the model is most secure and inference is most reliable when the data are produced by a properly randomized design.
![]() When you use statistical inference, you are acting as if the data
come from a random sample or a randomized experiment.
If this is not true, your conclusions may be open to challenge. Do
not be overly impressed by the complex details of formal inference.
This elaborate machinery cannot remedy basic flaws in producing the
data such as voluntary response samples and confounded experiments.
Use the common sense developed in your study of the first three
chapters of this book and proceed to detailed formal inference only
when you are satisfied that the data deserve such analysis.
When you use statistical inference, you are acting as if the data
come from a random sample or a randomized experiment.
If this is not true, your conclusions may be open to challenge. Do
not be overly impressed by the complex details of formal inference.
This elaborate machinery cannot remedy basic flaws in producing the
data such as voluntary response samples and confounded experiments.
Use the common sense developed in your study of the first three
chapters of this book and proceed to detailed formal inference only
when you are satisfied that the data deserve such analysis.